|
If you live in Texas, it may seem like a lot of cold fronts have been moving through. Well, truth be told, you're correct. So far this month, there have been five cold frontal passages in North Texas, with another one on Monday, ending the month with six, which is abnormally high if you ask me. However, this most recent front along with the front on Monday aren't like many of the fronts we have seen this month so far. These fronts are what Texans call, "Blue Northers" or "Texas Northers". So that begs the question, what is a Blue Norther? Simply put, they are very strong, fast moving cold fronts, that contain polar and arctic air. They result in rapid temperature drops (10F-40F+ temperature drop in the matter of minutes to a few hours!), gusty winds, dust storms, and sometimes precipitation in its many forms depending on your location. Severe weather is also possible with the passage of these fronts, partially due to the stark contrast in air masses. They are most common between mid-fall and late winter. They can be problematic at times for farmers, who can lose crops due to the cold temperatures. Origin The next question you're probably asking is how did they get their name? The exact origin of, 'blue', is unclear, but one possible explanation is the blue/grey/black appearance of clouds along the leading edge of these fronts. Another possibility is the resultant blue sky left after the front moves through. The last possible origin is people are said to turn blue after the frontal passage due to the cold, which to me seems far-fetched. The origin of, 'norther', is thought to be where the front originates from. You may also hear of these fronts referred to as, "Texas Northers", due to the fact that they occur here often. Synoptic Pattern You may be wondering, why has Texas received so many Blue Northers this month? The reason for this is due to the current state of the upper atmosphere. It is set up in such a way that allows this cooler air to spill south. Let's take a look so you can get a better idea: 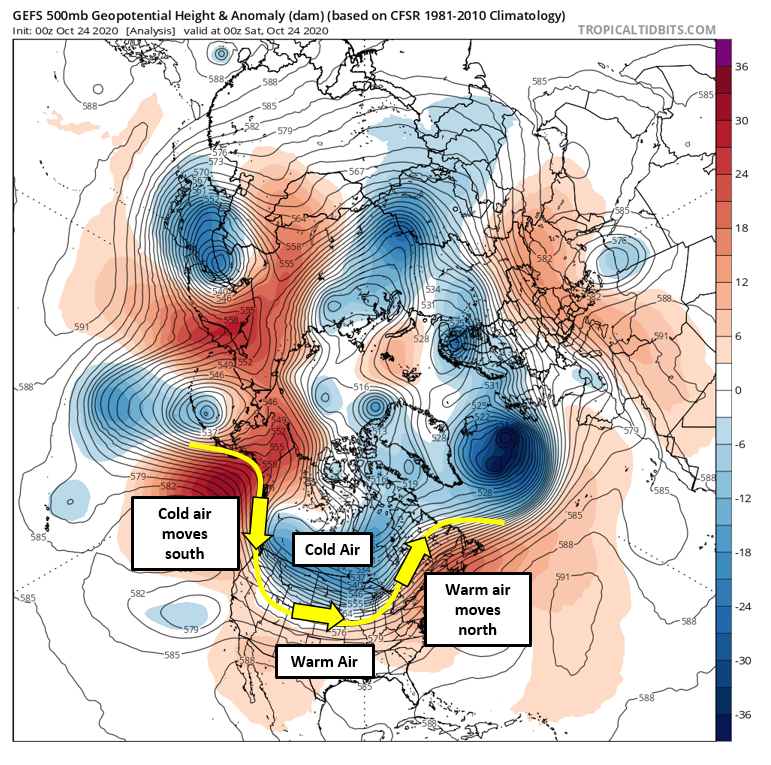 In the image above, we are looking at the mid-levels of the atmosphere. The reds represent area of higher pressure, and the blues represent areas of lower pressure. Areas of higher pressure can serve as atmospheric "blocks", which can disrupt/divert the natural flow of air to put it simply. The yellow line serves two purposes. First, it separates the "cooler" air to the north, from the "warmer" air to the south. Secondly, it represents the direction of the wind flow, as shown with the yellow arrows. Naturally, cooler air originates across the higher latitudes (near the North Pole), however, given the wind flow, some of this cooler air is directed southward, and some warmer air is advected northward as illustrated. This is roughly where the frontal boundary lies, so imagine a cold front where the yellow line is across the central US. The actual surface front is located a bit further south of the yellow line. In the image below, which is about 2.5 days later, notice how this cooler air (front) has moved even further south, and is now focused over the Desert Southwest and the better part of the Southern Plains. What caused this air (front) to move further south? To keep things very simple, which is my goal of this blog , the reds (high pressure) and blues (low pressure) oriented themselves (via dynamical processes) in such a way to deflect this cold air (front) further south. 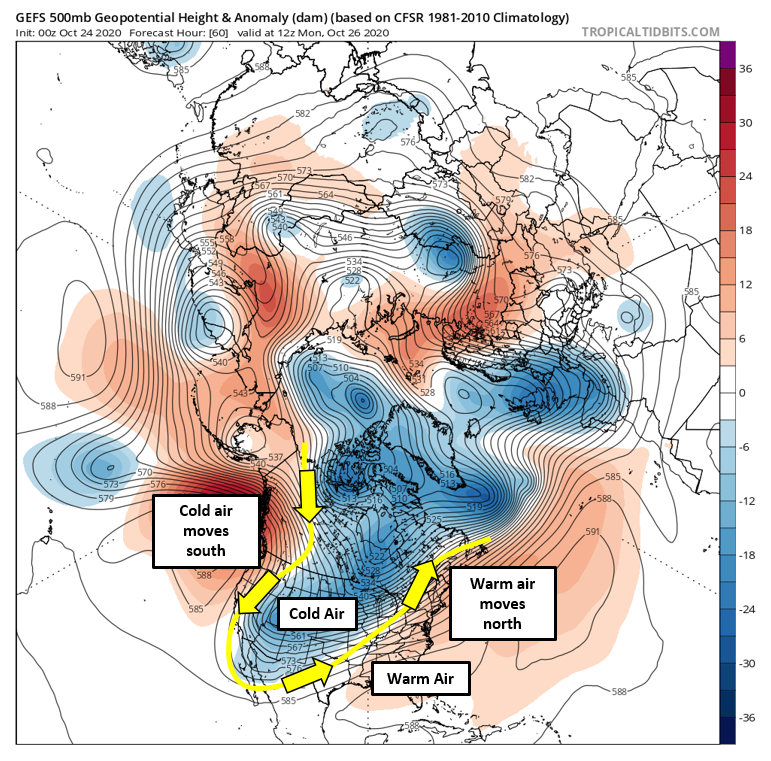 So going back to our original question of what is causing all these cold frontal passages this month, you can attribute it to the way the mid and upper atmosphere is set up (oriented). Our synoptic pattern for most of October has featured ridging (reds) over Alaska/North Pacific, and troughing (blues) over the Canadian Prairies and Great Plains. This has allowed cold air to spill south frequently, resulting in these drastic temperature swings. What to Expect Monday Monday's cold front will be the strongest of all of them we have seen so far this month, where most of West Texas and some of North Texas will see sub-freezing temperatures, after being roughly 20F-60F warmer 24-hours prior. The Texas Panhandle is more susceptible to Blue Northers (and sharper temperature drops) since they heat up nicely during the day, but are closer to the cold source, in addition to being at a higher elevation than North Texas. Below are the 24-hour temperature changes the GFS is expecting on Monday following the passage of the Blue Norther: 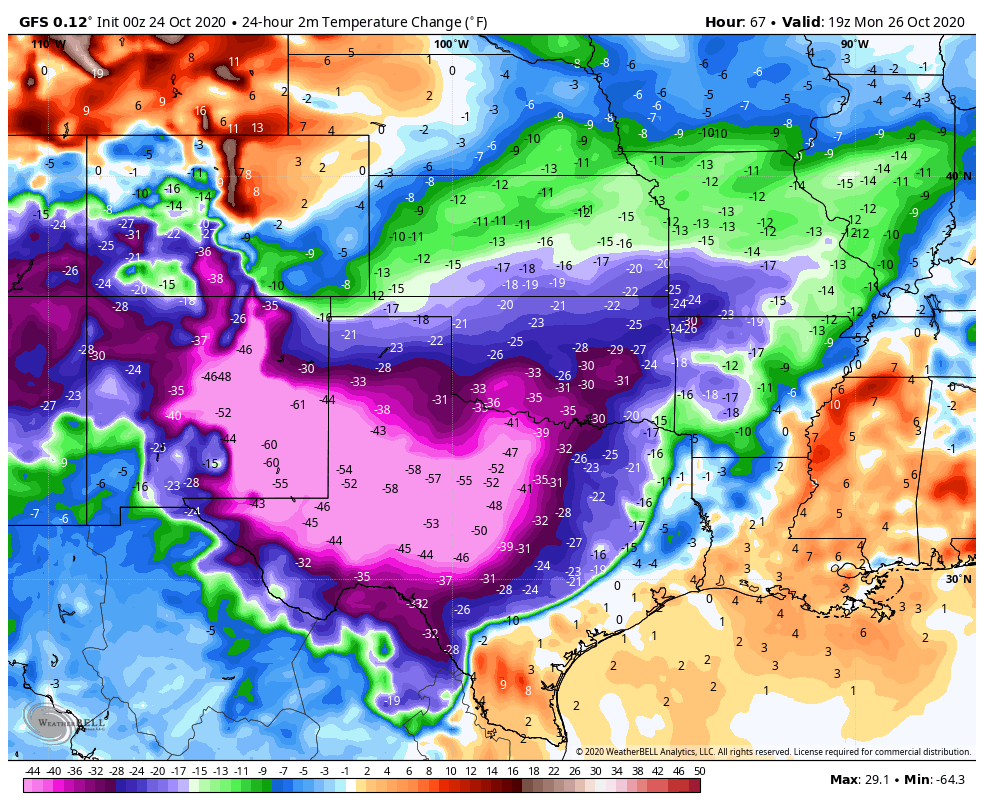 While Blue Northers are common in Texas, they occur elsewhere as well. The most historical Blue Norther on record occurred on November, 11, 1911. Here are a couple links that summarize that day:
en.wikipedia.org/wiki/Great_Blue_Norther_of_November_11,_1911 www.weather.gov/sgf/events_1911nov11 VERIFICATION The largest 24-hour temperature difference for DFW was only 18F. However, the frontal passage was still the spark for a brief pattern change.
0 Comments
As we all keep our eyes on the potential tropical activity in the Gulf of Mexico, a common meteorological term that has been used is, “Central American Gyre”, also known as a “CAG”. What is it exactly? A CAG is a broad, closed area of circulation centered over Central America and can be difficult to forecast. These circulations usually only occur 1-2 times per year during the rainy season (May-November). They are most common in May-June and September-November. They are not so common in July-August due to evolution of seasonal flow (anomalous low level easterlies are more prevalent than westerlies due to an extension of the Caribbean low-level jet). What risk do they carry? CAGs are known to bring significant rain/flooding to Central America, as well as being a focal point for tropical cyclogenesis (Hurricane Michael (2018) originated from a CAG). On average, they carry a lifespan of a little over three days. How do they form? CAGs are preceded by anomalous low level westerly flow in East Pacific which appears to be the main contributor to CAG formation. There are several possibilities as to why these westerly winds pave way for CAG development but simply put, these westerly winds in the eastern Pacific interact with easterly winds from the Caribbean developing cyclonic curvature vorticity. As these winds converge/interact, deep convection can result, leading to latent heat release. This latent heat release redistributes the potential vorticity (PV) below itself which enhances cyclonic circulation. Another possible contributor in CAG formation is the high terrain of Central America. Within the higher terrain lie gaps, where winds funnel through and interact with each other, resulting in low-level vorticity. The anomalous low-level westerly winds that are favorable for CAG development generally occur when the MJO is in phases 1,2 & 8. Once a CAG forms, they characteristically have "lobes" of vorticity that circumnavigate about the broad circulation. Some of these "lobes" can develop into tropical disturbances when in the right environment and break away from the gyre. CAG Classifications There are two types of CAGs to become familiar with: Non-baroclinic
Baroclinic
Forecasting CAGs To be officially classified as a CAG, certain requirements need to be met. Here is a link that describes these requirements. To forecast CAGs, click here. Below is a screenshot depicting what a CAG is and the necessary requirements using the graphics from the website provided (Image credit: Papin) 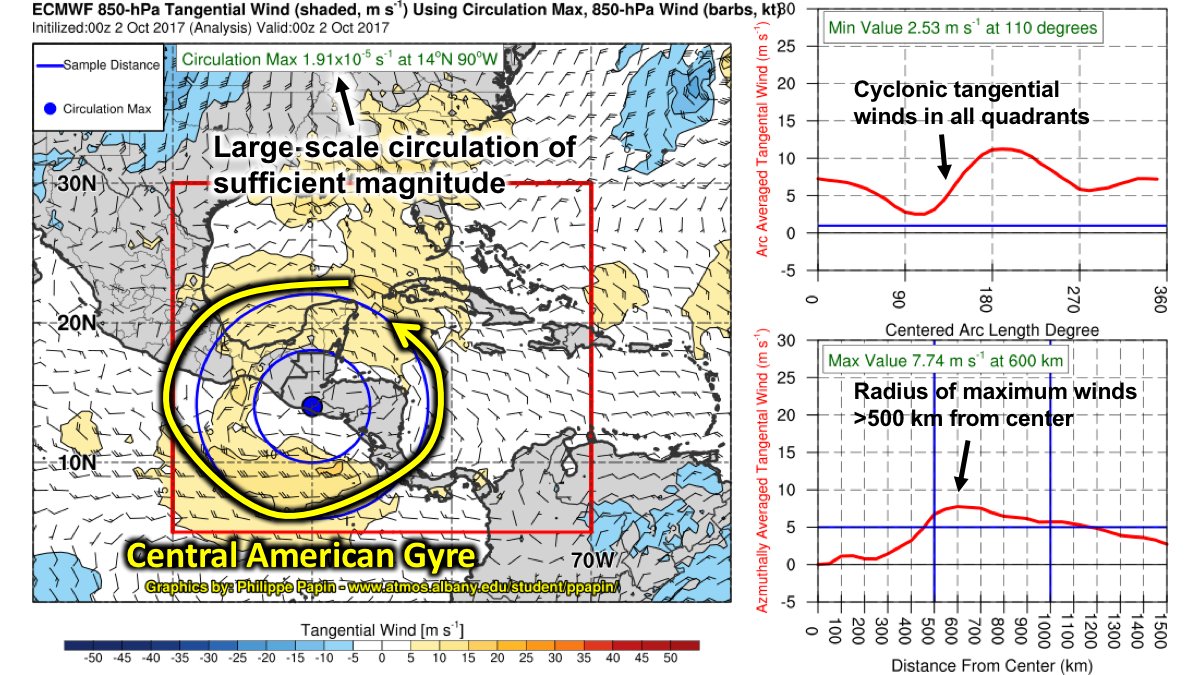 Source: Papin et.al 2017
|
