|
With October Eurasian Snow Cover data now available, the following is the first update to my preliminary forecast made back in August. This outlook will still likely change from time to time as newer information is received and forecast confidence increases. The structure of this outlook will be the same as before, going through each teleconnection separately, and then at the end tie it all together. So let's see what has changed: El Nino Southern Oscillation (ENSO) Since my initial forecast, not much has changed in the grand scheme of things other than the likelihood of La Nina carrying through the rest of the year is pretty much a lock, albeit a continuing weakening trend as expected. La Nina has become stronger since my initial forecast which is why confidence is high this will persist through the rest of 2022. Once the calendar flips to 2023, I am anticipating La Nina to be weak before becoming neutral sometime in January or February. 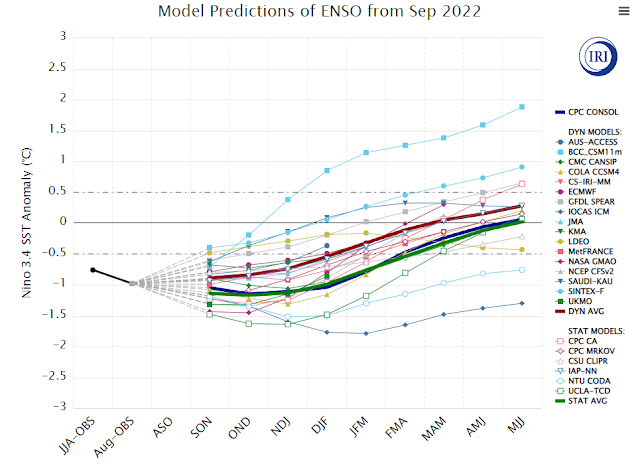 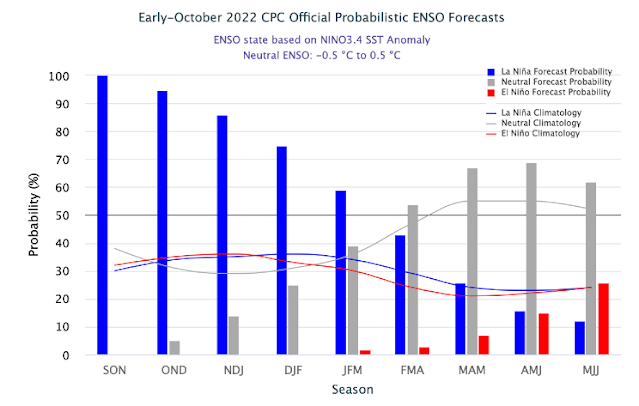 Indian Ocean Dipole (IOD) The IOD remains firmly negative as indicated by the strong westerly winds across the western Indian Ocean. It is forecast to remain negative (although maybe not as strong as it currently is) through at least the end of the year, similar to La Nina. The -IOD helps reinforce La Nina, which is another reason why it will be difficult to wash out La Nina before the end of the year. The IOD climatologically falls back to earth around January, so it could leave La Nina more vulnerable to a transition around that timeframe. 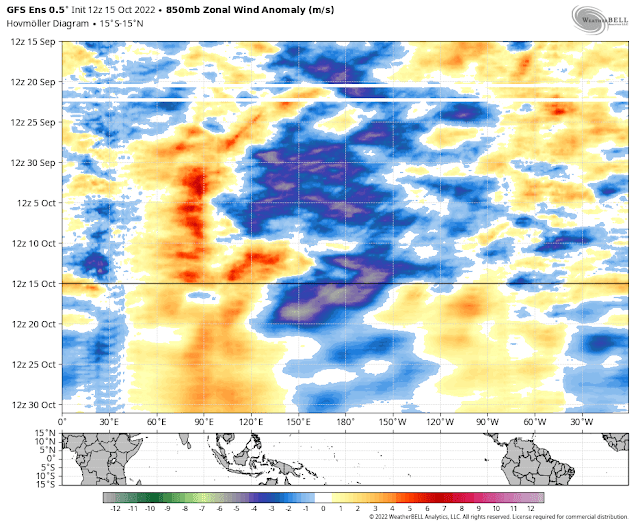 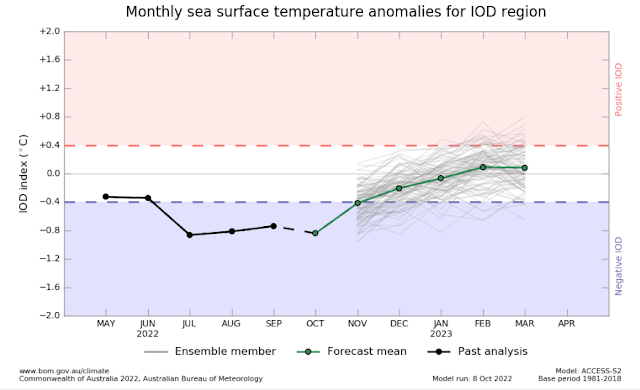 Quasi-biennial Oscillation (QBO) The QBO remains westerly and will likely remain in said phase through at least early next year. A +QBO usually means a stronger jet stream. As a result, an uptick in winter storms could be favored, however at face value the chance of Arctic intrusions are lower. There is still a lot of research being done on the QBO and its exact affect on winter weather so just keep that in mind when reading any forecast that integrates the QBO. 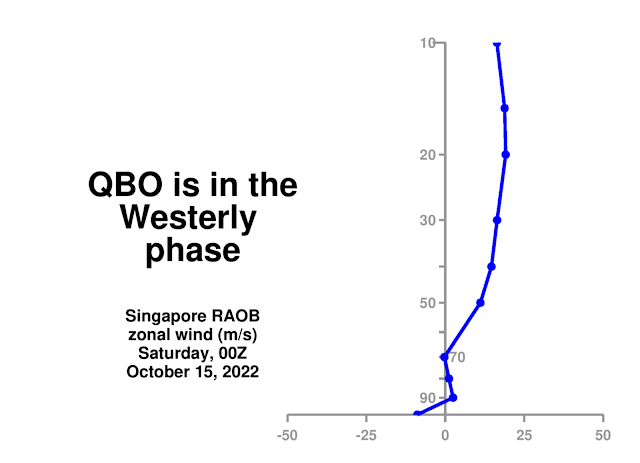 Pacific Decadal Oscillation (PDO) The PDO has been negative since late 2019, which also interacts with ENSO. When the PDO and ENSO are in phase with one another (like they currently are), ENSO tends to be "stronger". Having said that, I also expect this index to remain negative through at least the winter season despite it "weakening". The water east of Japan is just far too warm to allow this index to flip positive. 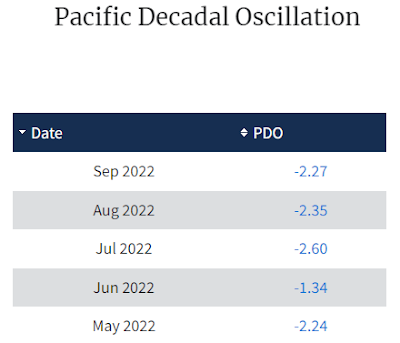 Atlantic Multidecadal Oscillation (AMO) The AMO (SST anomalies over the North Atlantic Ocean) continues to remain positive, and will continue through this winter season. A +AMO favors the frequency of a -NAO which is an important piece to netting big winter storms. 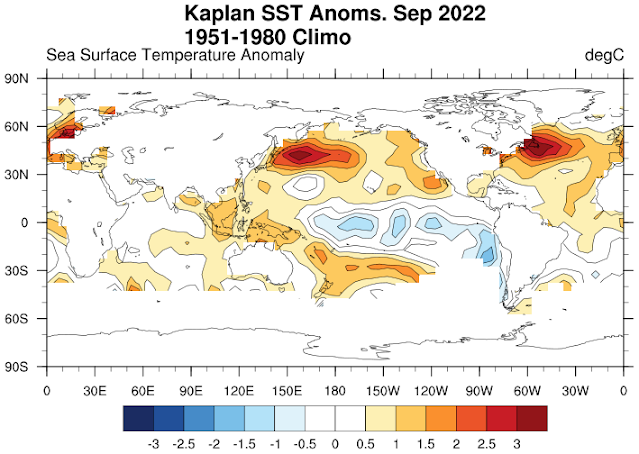 October Eurasian Snow Cover Extent Now that we are midway through October, Eurasian snow cover was above normal to begin the month, but has since come back to Earth, and is currently in the bottom tier for this time of the month. Long-range models indicate a synoptic pattern that should allow this index to finish near, if not slightly above average to end the month. Eurasian snow cover extent in the fall helps strengthen the Siberian High via surface cooling. As a result, poleward heat flux increases, weakening the stratospheric polar vortex which can result in a -AO in the troposphere, promoting cold air intrusions across North America. 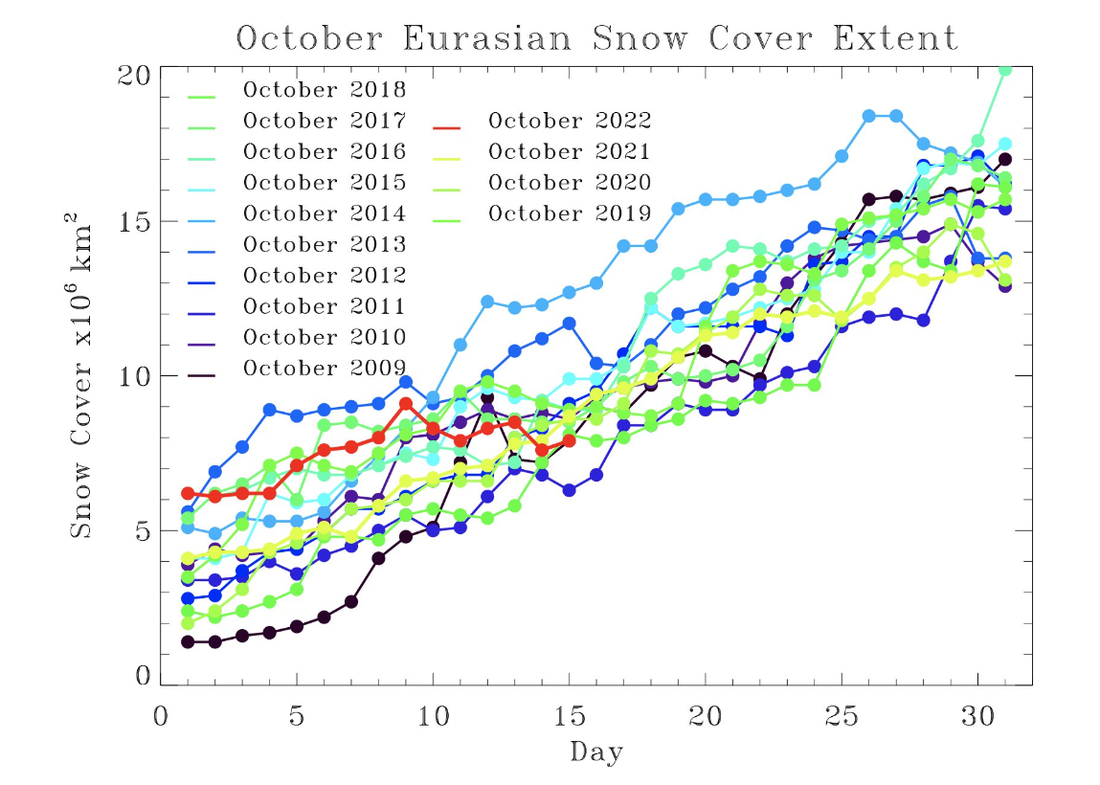 Image Credit: Dr. Judah Cohen (www.aer.com) 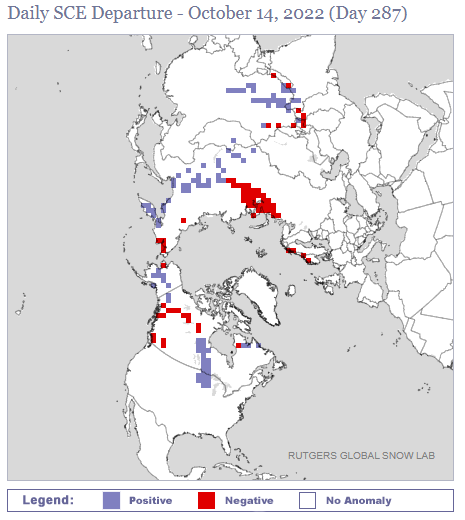 Methodology After sorting through everything again, I decided to keep my dataset the same as my initial update (those that closest match my forecast values for each index), however my "adjustments" to the final composites are a bit different than before when taking Eurasian Snow Cover Extent into consideration. Starting with ENSO, I selected years where the Nino 3.4 ONI for DJF & JFM was between -0.9 and 0C since we will likely be looking at a weak La Nina by the end of the year, possibly becoming neutral in early 2023. From there I filtered that down to years where the ONI reduced between DJF & JFM. For the IOD, I selected years that it had a negative index in any regard (note: -0.4 to 0.4 = neutral IOD) concurrently with the filtered La Nina years I chose. For the PDO, I selected years that it was in a negative phase concurrently with the filtered La Nina years I chose. For the QBO, I used the same process for when it was in a westerly phase. Lastly for the AMO, I selected years that it was in a positive phase concurrently with the filtered La Nina years I chose. Once I ran my filters and looked everything over, the IOD years I had selected were not negative or positive enough (i.e. neutral) to give it much weight in my forecast. Lastly, for Eurasian Snow Cover Extent, the dataset is not large enough to integrate into my forecast, so I elected to leave it out when generating my composites however I did give it some weight in my final forecast for this update. At the end of all this, I had eight sets of years to pick apart further. The years that matched the best to what I'm expecting were 1964-1965 & 1971-1972. Breaking those two sets of years down, 1964-1965 had a weak La Nina in 1964, becoming neutral in early 1965. It also had a -PDO & negatively neutral IOD between December-March. 1971-1972 had a weak La Nina in 1971, becoming neutral in early 1972. It also had a +QBO between December-March. The biggest difference between these two datasets was that 1964-1965 had a negatively neutral IOD (1971-1972 had a positively neutral IOD), and 1971-1972 had a moderately +QBO (1964-1965 had a weak, -QBO). When running the analogs of these years separately, they were nearly identical, with the exception that the Central Plains showed negative temperature anomalies in 1964-1965. New England also showed negative precipitation anomalies that year. Below are 1964-1965 & 1971-1972 blended composites.  I had three other sets of years that had the second best analog scores which I took into consideration (1983-1984, 2005-2006 & 2011-2012). Aside from having a weak La Nina either becoming neutral or staying weak by the early part of the following year, they all matched up with either a -PDO, +AMO or negatively neutral IOD index so I decided they were worth including. The last three sets of years (1954-1955, 1995-1996 & 2000-2001) did not match up with any of the indices I was teleconnecting, so I decided to omit them. Forecast Bringing everything together, the following are the composites that were generated. Reading this verbatim, the NW U.S. and Rockies will see average to below average temperatures, with the rest of the country experiencing above normal temperatures, notably the Eastern U.S. Analyzing the precipitation graphic, most of the country will receive average precipitation with a couple exceptions. The Pacific NW will see above normal precipitation and central-southern California/Desert SW will see below normal precipitation. The 500mb composite supports the cold outlook fairly well, with deep troughing extending from the Western to Central U.S., with neutral heights over the Pacific and Atlantic coasts. My "adjustments" to the following composites are as follows:
Not shown, but I've also looked at the SEAS-5, CFSv2 & NMME seasonal forecasts. This blog post is already long enough so I won't dive into extensive details here, but I think SEAS-5 and NMME are running too warm, however I do like the look of the CFSv2 from a temperature standpoint, which has more of a classic Nina look to it for DJF & especially JFM; definitely a model I'll be following along with over the next few months. If you've made it this far, thanks for reading and stay tuned for additional updates as more information is received. 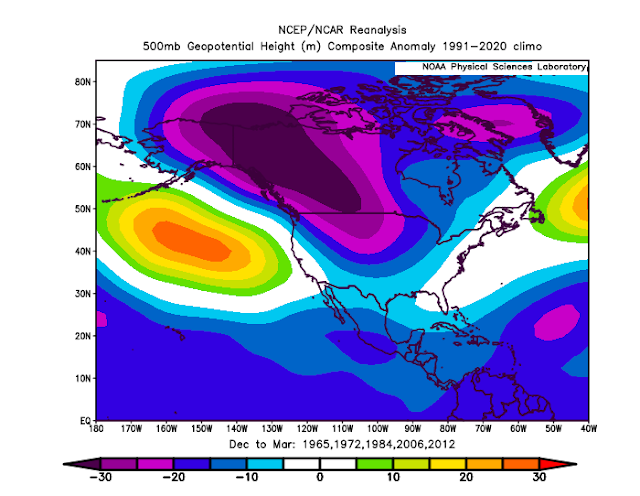 VERIFICATION This past winter threw many for a loop, as many seasonal forecasts, including my own, were far off from what actually materialized. Temperatures were well above normal for the Eastern U.S., and cooler than normal for the Western U.S. Most of the Midwest & Desert SW finished with above average precipitation, whereas the Mid-Atlantic, Florida, Southern Plains & Pacific Northwest finished below average. 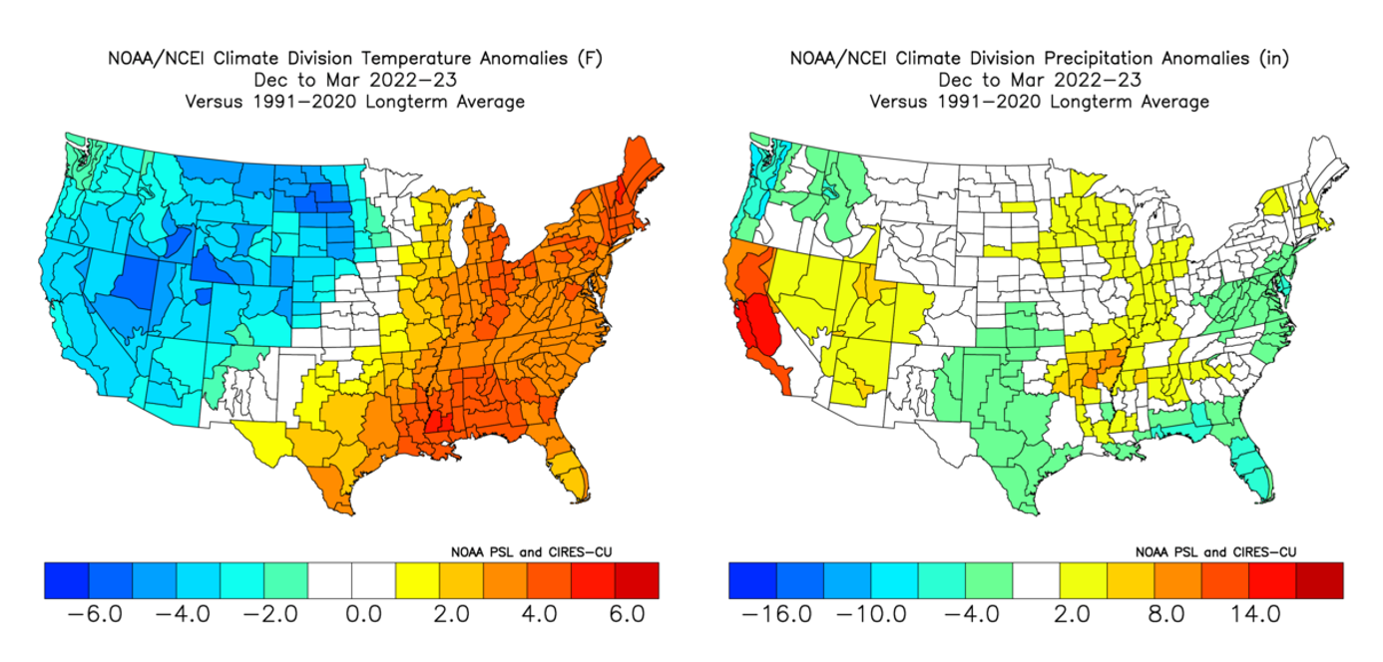 Persistent ridging across the Eastern U.S., troughing across the Pacific Northwest/California and strong ridging over the Aleutians were the large contributors to this, keeping the synoptic pattern rathter stagnant with all of the blocking. Most of the Midwest & Desert SW finished with above average precipitation, whereas the Mid-Atlantic, Florida, Southern Plains & Pacific Northwest finished below average. 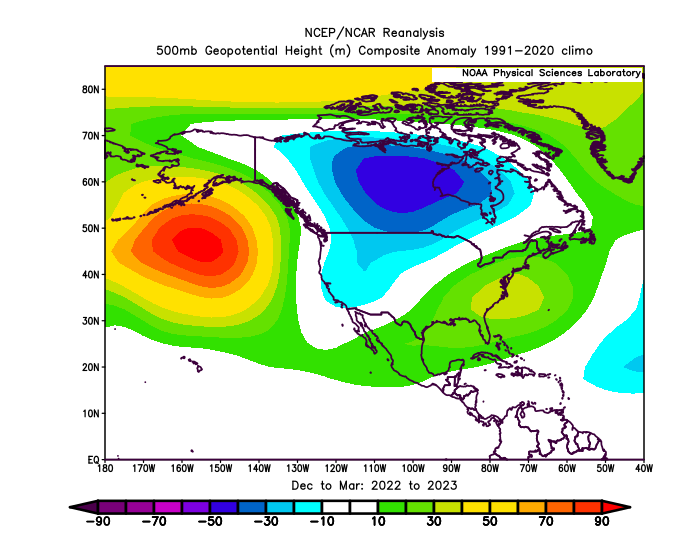 So what went wrong? There are many factors, known and unknown, that determine how a season plays out. Teleconnections are heavily referred to when creating a winter forecast, and tend to have a good level of reliability, but not all the time as history has shown. This winter is a perfect example of that. From a teleconnections standpoint, my forecast was accurate. The ENSO forecast was spot on, with La Nina becoming Neutral by early 2023. The QBO remained westerly, the IOD was neutral, the PDO remained negative & the AMO stayed positive. As far as October Eurasian snow cover is concerned, it started out above normal to start the month, but then plateaued shortly thereafter. It finished above normal but nothing that jumped off the charts per se. If most of the teleconnections verified, what may have caused this winter's forecast to be so far off? It's hard to say for certain, but there has been conjecture that this anomalous winter was largely influenced by the Hunga Tonga volcanic eruption back on January 15, 2022. A large amount of water vapor was transported into the stratosphere, and thus may have had impacts on the behavior of the troposphere & stratosphere, resulting in what was a very blocky pattern this past winter. Below is an image of atmospheric water vapor anomalies over time. Notice the dark greens around 30mb and up beginning in 2022. There is a very high chance this influenced our anomalous winter 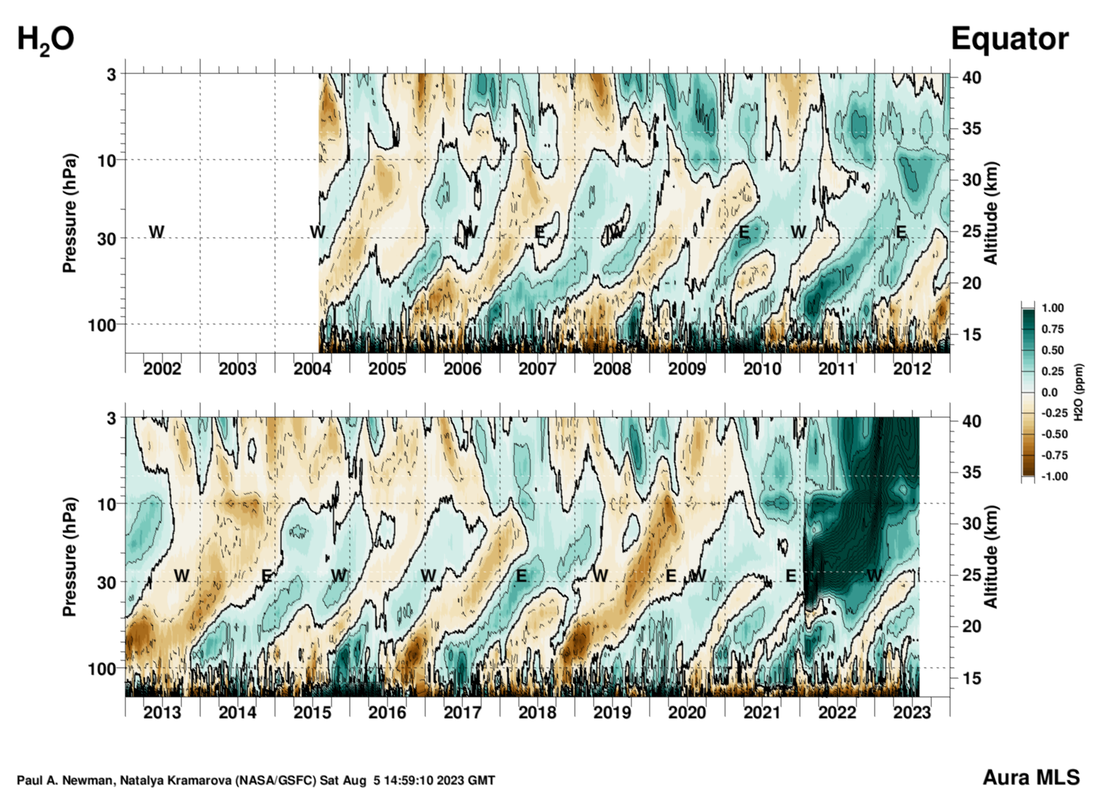
0 Comments
|
