|
Frequently, people use the term, "polar vortex", but what few may know is that there are actually two kinds (tropospheric & stratospheric). So what's the difference? The tropospheric polar vortex (TPV) is larger and lasts year round. The stratospheric polar vortex (SPV) on the other hand only exists between fall and early-mid spring before it breaks down. Thus, these two features are not directly correlated, but may influence each other at times. Below is a schematic from Waugh et.al (2016) that shows the disparity between the two. Notice that at around 100 hPa (tropopause), there is a pretty clear cutoff between the two types of vortices. During the boreal winter, you will also notice that both vortices are stronger than during the summertime. Come spring, sunlight returns to the polar regions and high latitude westerly winds weaken and slow down before becoming easterlies by summertime. 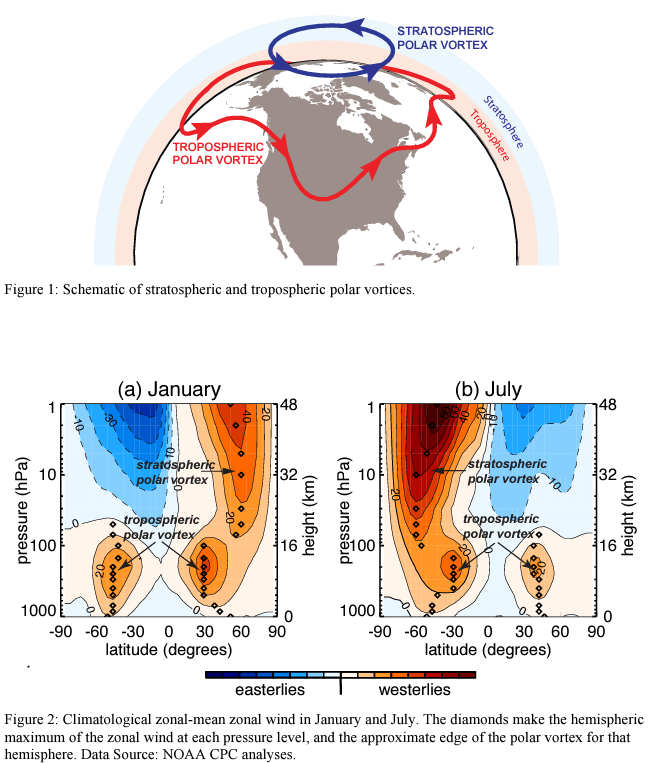 The SPV is generally strongest around 60 N/S and appears each winter as a result of large-scale temperature gradients between the mid-latitudes and the pole. The TPV is usually strongest around 45-50N/S, and usually has one or two centers, oftentimes more on a day to day basis.
These two types of vortices also impact our surface weather in different ways. The TPV can be the primary source of cold air when it is displaced from the poles. The SPV on the other hand is a bit more complicated. In order to see the impacts of the SPV, it needs to become unstable. It becomes unstable via a phenomenon known as Sudden Stratospheric Warming which you can read about here. Hopefully this brief overview provides more clarity on the main differences between these two vortices and assists you in better understanding how they impact our surface weather.
0 Comments
The Southern Oscillation Index (SOI) is an index that is derived from sea level pressure differences between Tahiti (eastern Pacific) and Darwin, Australia (western Pacific). The SOI corresponds well with changes in ocean temperatures across the tropical eastern Pacific. The negative phase of the SOI represents below-normal air pressure at Tahiti and above-normal air pressure at Darwin. The positive phase of the SOI represents above-normal air pressure at Tahiti and below-normal air pressure at Darwin . Prolonged periods of negative (positive) SOI values coincide with abnormally warm (cold) ocean waters across the eastern tropical Pacific which is indicative of El Nino (La Nina).
Source: www.ncei.noaa.gov/access/monitoring/enso/soi The narrative of this winter is much different than last, as we will be dealing with an El Nino winter versus a La Nina one last year. The last time we had an El Nino winter was 2018-2019. Based on the current CFSv2 forecast, a strong ENSO is anticipated this winter, peaking at the end of 2023, with a likely weakening trend into moderate territory on the backend of the season (March timeframe). A competing forecast, the ECMWF, suggests a very strong El Nino, with weakening on the backend of winter, albeit still remaining in moderate to strong territory. 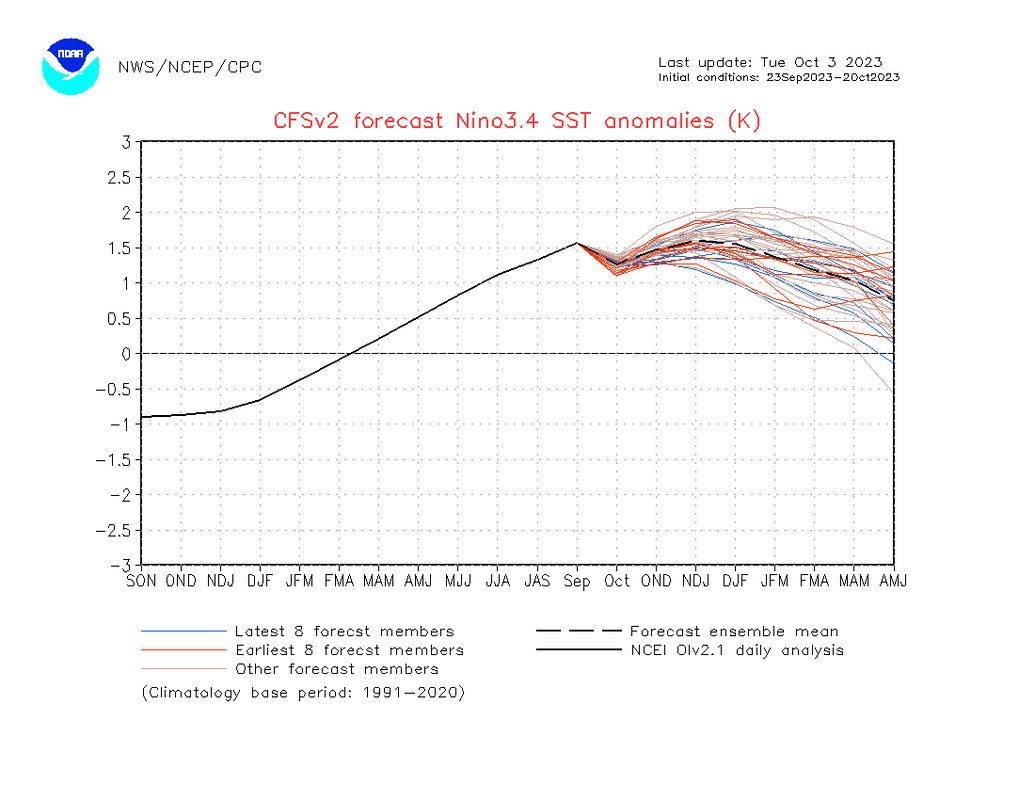 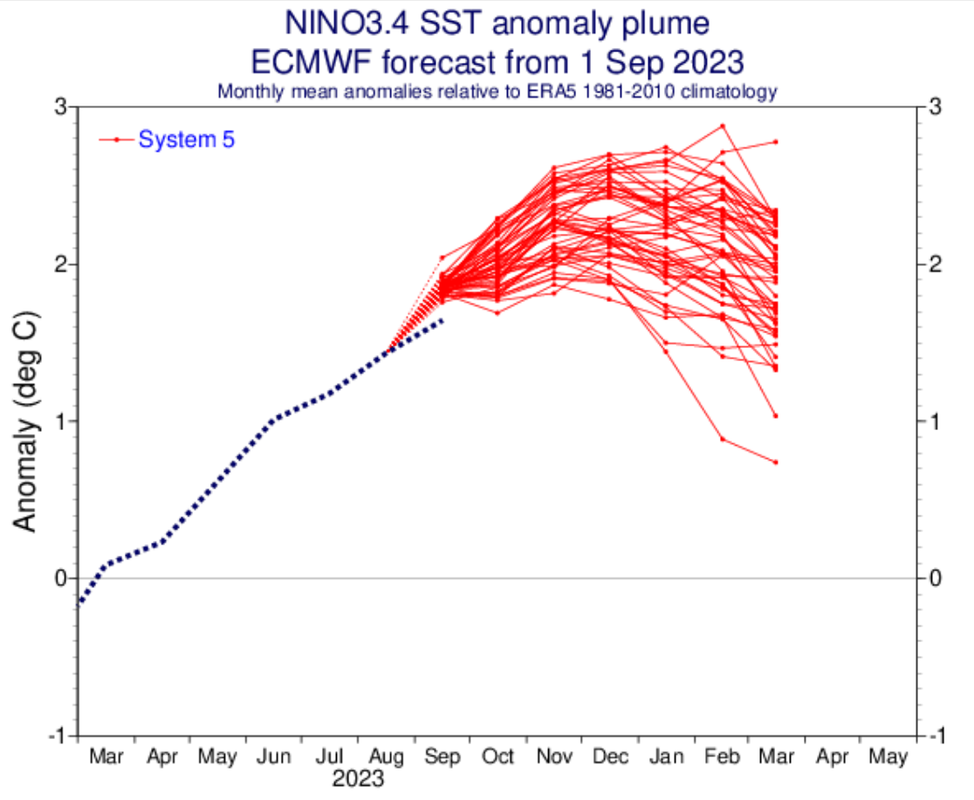 Based on current observations, it appears that we will be dealing with an East Pacific (EP) El Nino, as shown below. EP El Ninos are classified when the highest anomalies are concentrated across the East Pacific, versus say, the Western Pacific or even basin wide. 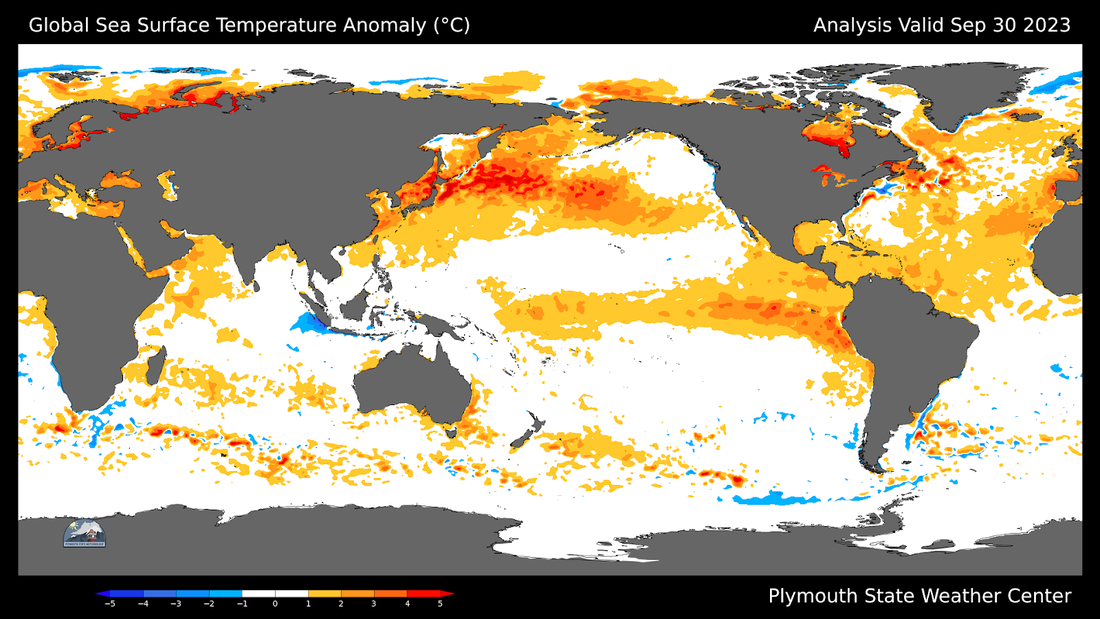 Now while this will likely be the case, both the CFSv2 and ECMWF (not shown) hint at a temperature crash in Nino regions 1+2 this month resultant of what has been persistent easterly winds across the Eastern Pacific, resulting in the upwelling of "cooler water". This "cooler water" is still water that is warmer than normal (see animation below), so while the EP El Nino signal may reduce some, I am still expecting an EP El Nino to prevail this winter. 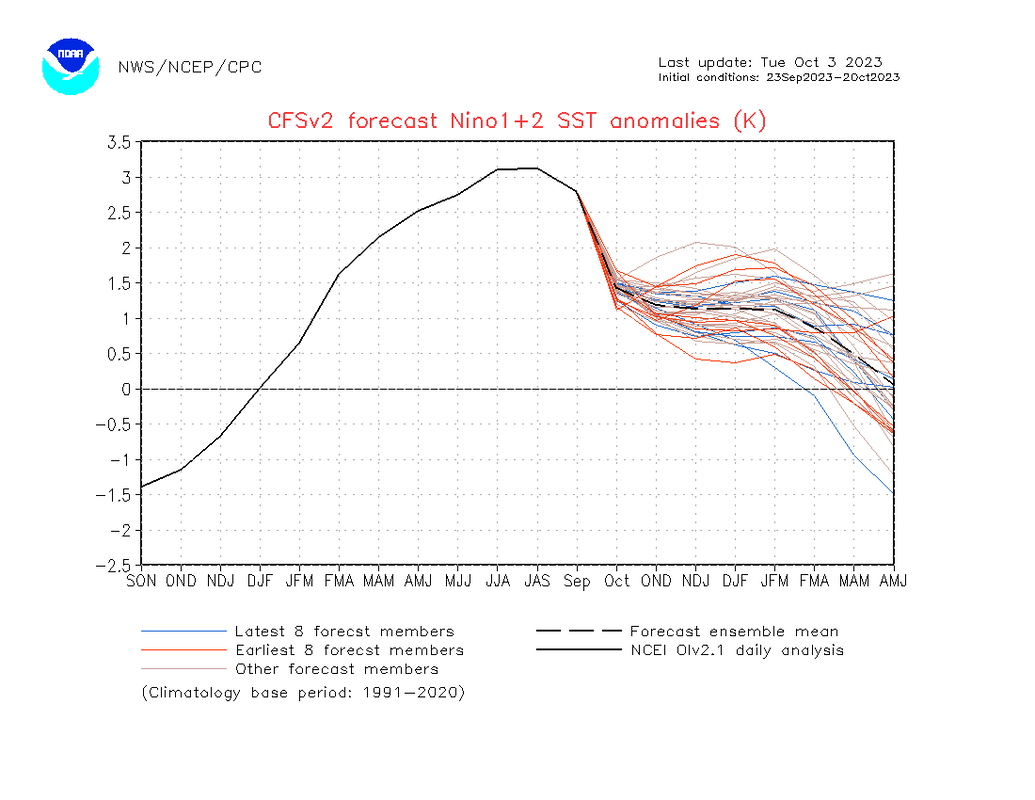 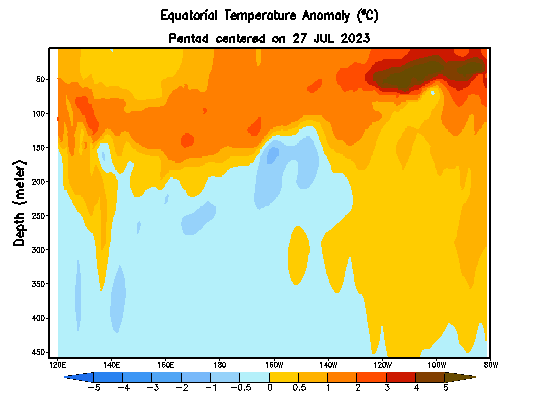 Now that we've combed through the expected state of ENSO this winter, let's look at a few other factors that could impact this winter: Indian Ocean Dipole (IOD) The IOD is currently positive and should remain so through at least January. When the IOD and ENSO are in phase with each other, the Walker Circulation extends further west closer to the Indian Ocean. This allows warmer water to travel further west, expanding El Nino's footprint per se. Despite them being in phase with each other, I do not expect it to have significant impacts on our weather pattern here in the U.S., however having said that, it is certainly not a bad thing to have if you like snow. In other words, I don't think it necessarily reduces snow chances here. 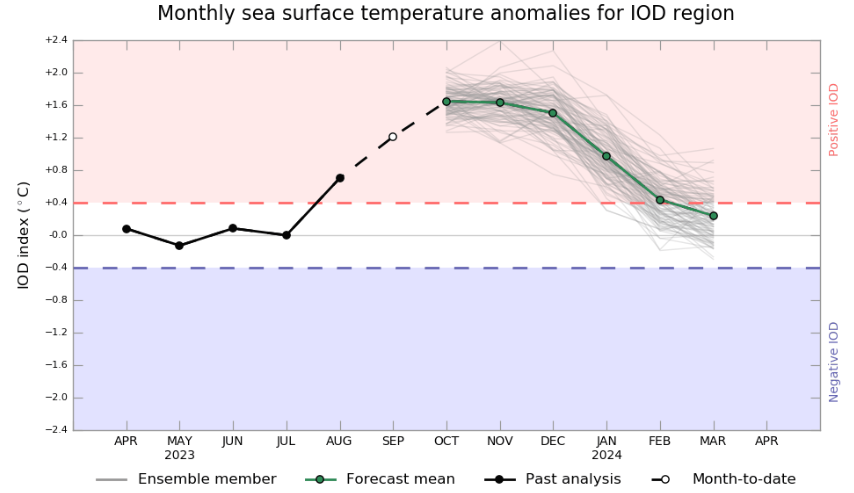 Quasi-biennial Oscillation (QBO) The QBO remains easterly and will likely remain in this phase through at least early next year given its periodicity. A -QBO can coincide with more sudden stratospheric warmings (SSW), a weaker Atlantic jet stream and cooler winters in the Eastern U.S. While not entirely reliable, this is definitely a piece of the puzzle that can tip the scales in favor of an active winter. 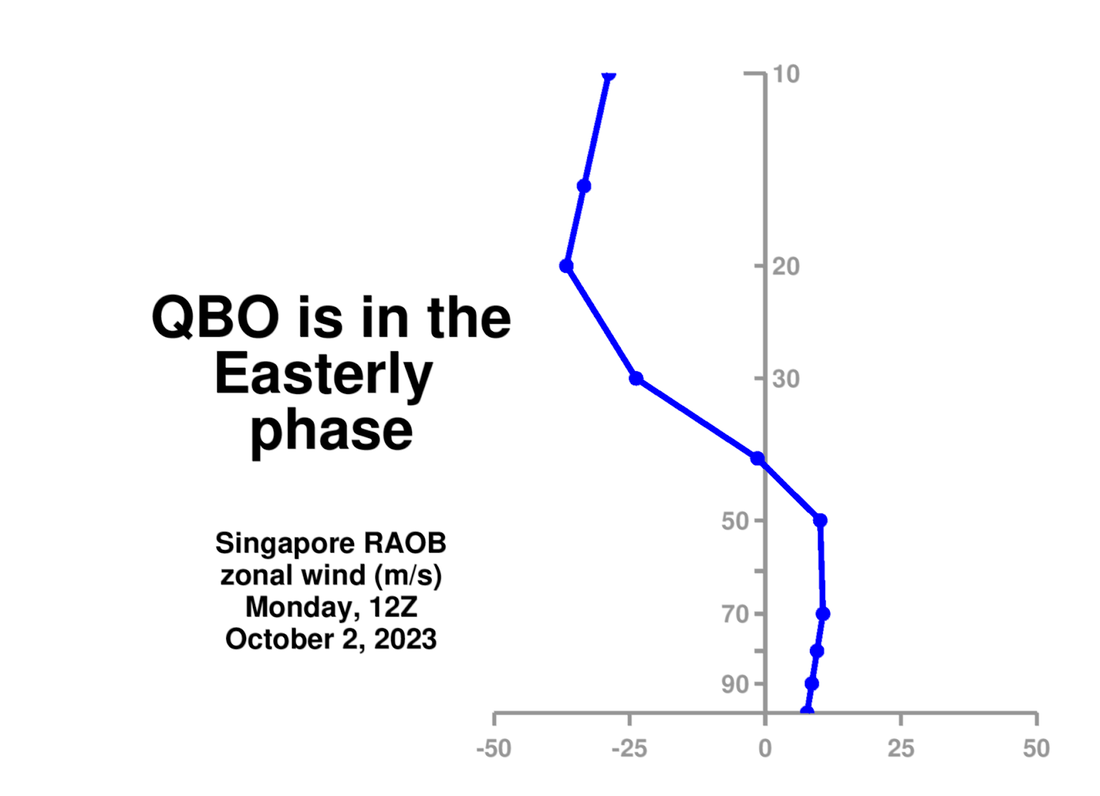 Pacific Decadal Oscillation (PDO) The PDO continues to be consistently negative (cool) since 2019, and I do not foresee this changing over the next several months, as the water east of Japan remains too warm. With the PDO and ENSO being out of sync this winter, the "effect" of ENSO may be diminished some, but to what extent remains uncertain. 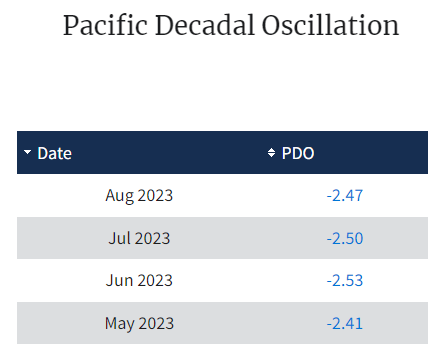 Atlantic Multidecadal Oscillation (AMO) The AMO is the warmest it has ever been this year. Generally speaking, a +AMO favors the frequency of a -NAO which favors productive winter storms, however we have also gone winters where this wasn't the case, deeming this oscillation less reliable than the others. 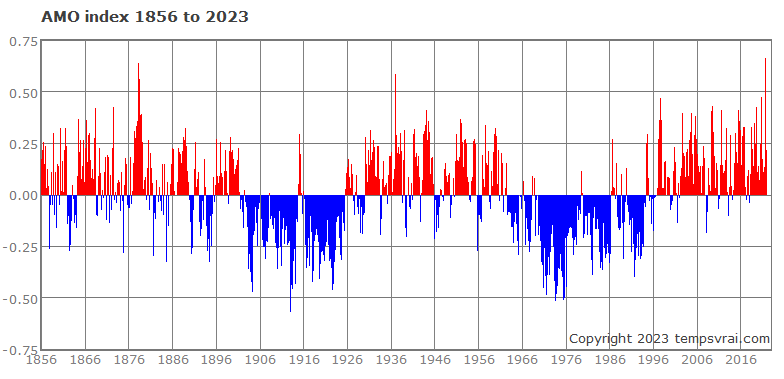 October Eurasian Snow Cover Extent Still too early in the month to fully assess this, but taking it for what it is, this appears to be par for the course, meaning nothing really stands out at this time to sway me one way or the other to integrate it into my forecast. This will be something to check week to week. Eurasian snow cover extent in the fall helps strengthen the Siberian High via surface cooling. As a result, poleward heat flux increases, weakening the stratospheric polar vortex which can result in a -AO in the troposphere, promoting cold air intrusions across North America. 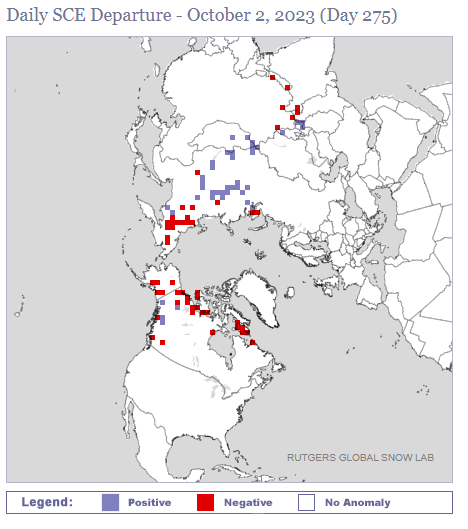 Stratospheric Water Vapor Something I never considered in last year's forecast, but it may have played a large role in the lack of Northeast U.S. snow last winter. This large influx of stratospheric water vapor from the Hunga Tonga eruption back in January 2022 could inconspicuously be influencing our climate for the next couple years. I don't think this large influx of stratospheric water vapor should be ignored heading into this winter, now seeing that is has finally worked its way into the mid-latitudes of the Northern Hemisphere. Water vapor of this magnitude presumably would promote higher moisture content in storms, equating to potentially stronger/more productive storms. I am admittedly not an expert in this area, so this is purely conjecture, but it has my interest! 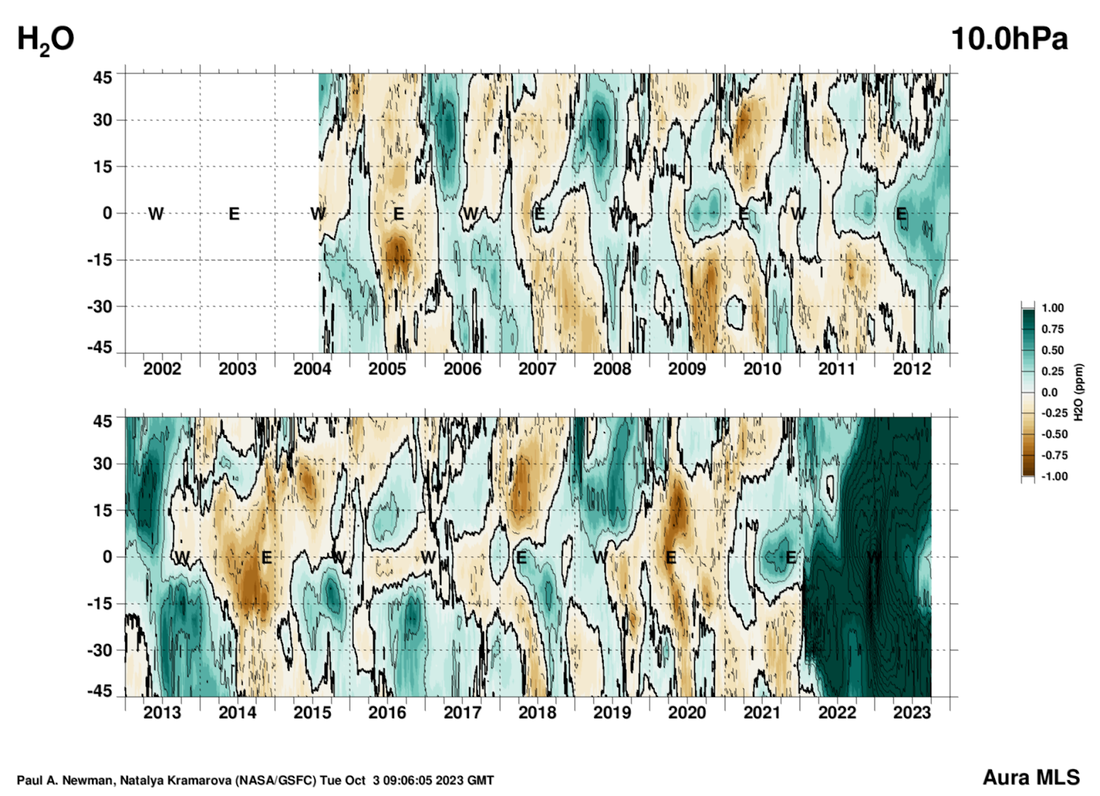 What are Models Showing? Current seasonal model guidance has a fairly promising look for productive Northeast U.S. snowfall, with Aleutian ridging (-EPO) and -NAO over Greenland (with the exception of CFS at the moment however I could see it coming around). In addition, an Eastern U.S. troughing signal is evident suggesting a stormy pattern. While these models can change for better or worse, it's good to see this type of agreement at given lead time. There's a chance these models don't verify either, which was the case last winter so while this is great to see, I certainly wouldn't "lock this in" at the moment. 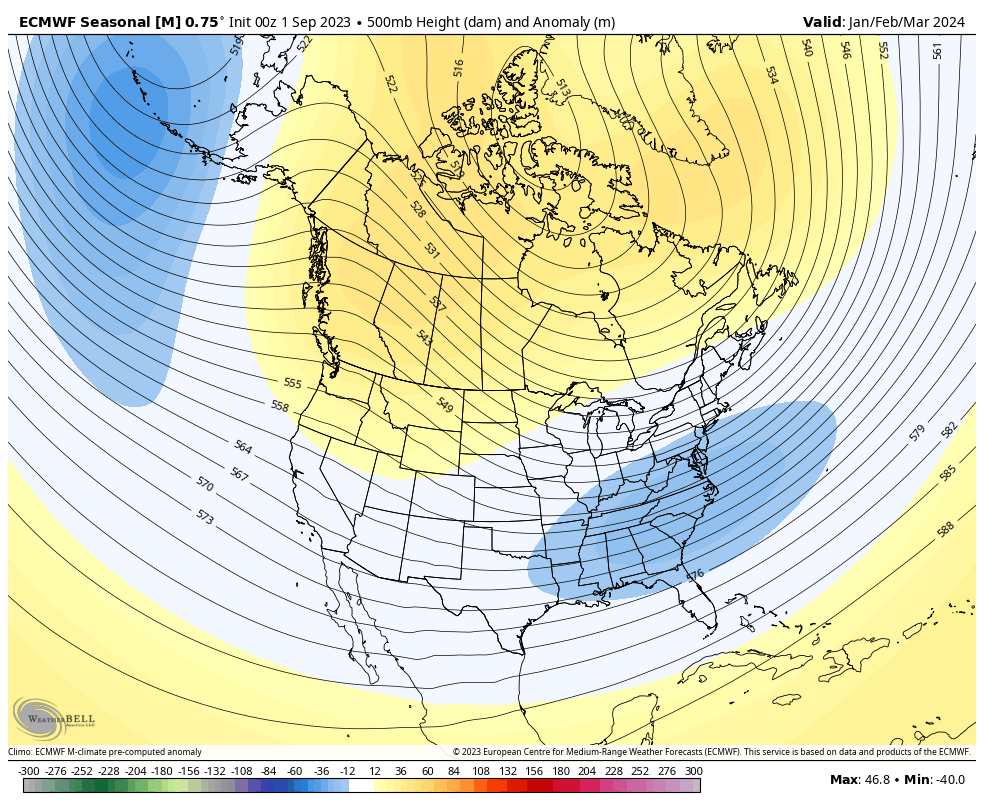 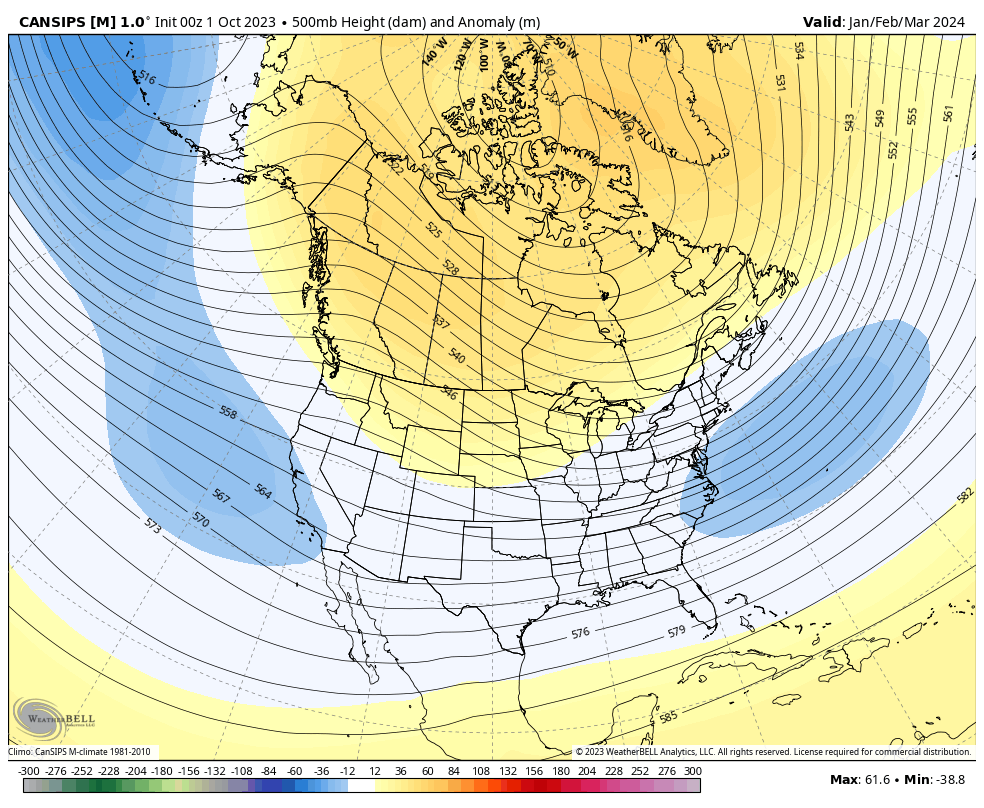 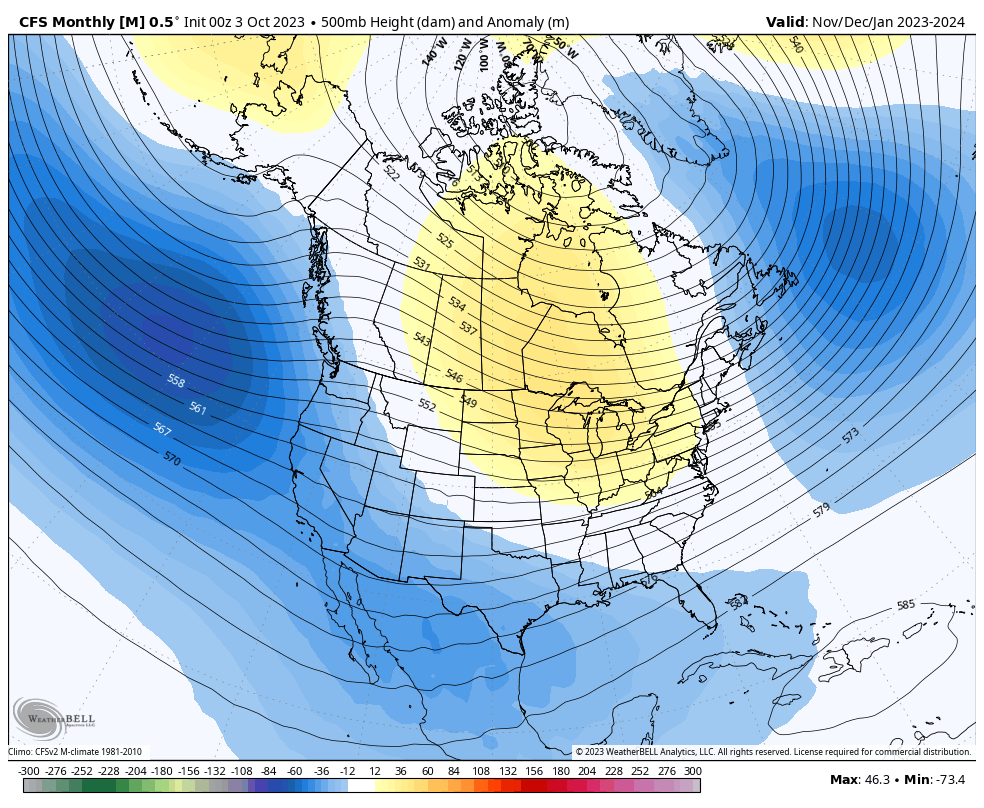 Methodology This year I am approaching things a little bit differently compared to last year. Rather than solely selecting years that "meet the highest set of criteria", I am going using a blend of years that meet some of the criteria, along with intuition. Right off the bat, I've elected to give little weight to the IOD, PDO, AMO and Eurasian Snow Cover Extent. Regarding the QBO, I am giving it weight this year, but a bit less than I have in past years, mainly because I don't think it plays as big of a role as some may think it does despite the correlation. Scientifically speaking it can certainly enhance increased snow chances in the Northeast U.S., but that wasn't always the case when looking back on historical records. I am also giving the uptick in mid-latitude Northern Hemispheric stratospheric moisture content weight this season, as I think it could feed some extra moisture into winter storms this year. My seasonal forecast will be largely based on a blend of strong ENSO analogs. Based on my subjective analysis, there has only been two winters on record (1957-1958 (CP) & 1991-1992 (CP)) that have reported a strong El Nino, that either strengthens or holds steady during the wintertime. Those two winters were completely opposite, with 1957-1958 being a productive winter for the Northeast U.S., where 1991-1992 was a dud. Of note 1957-1958 had a +QBO and 1991-1992 had a -QBO. 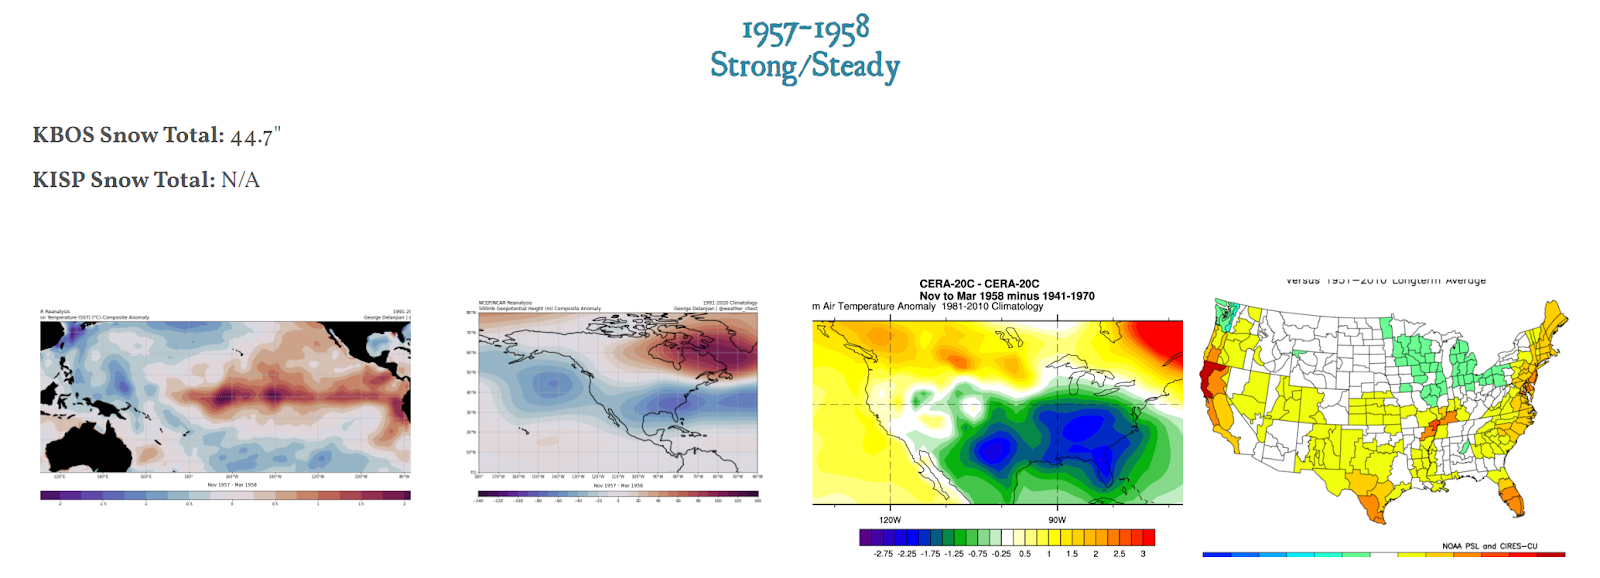 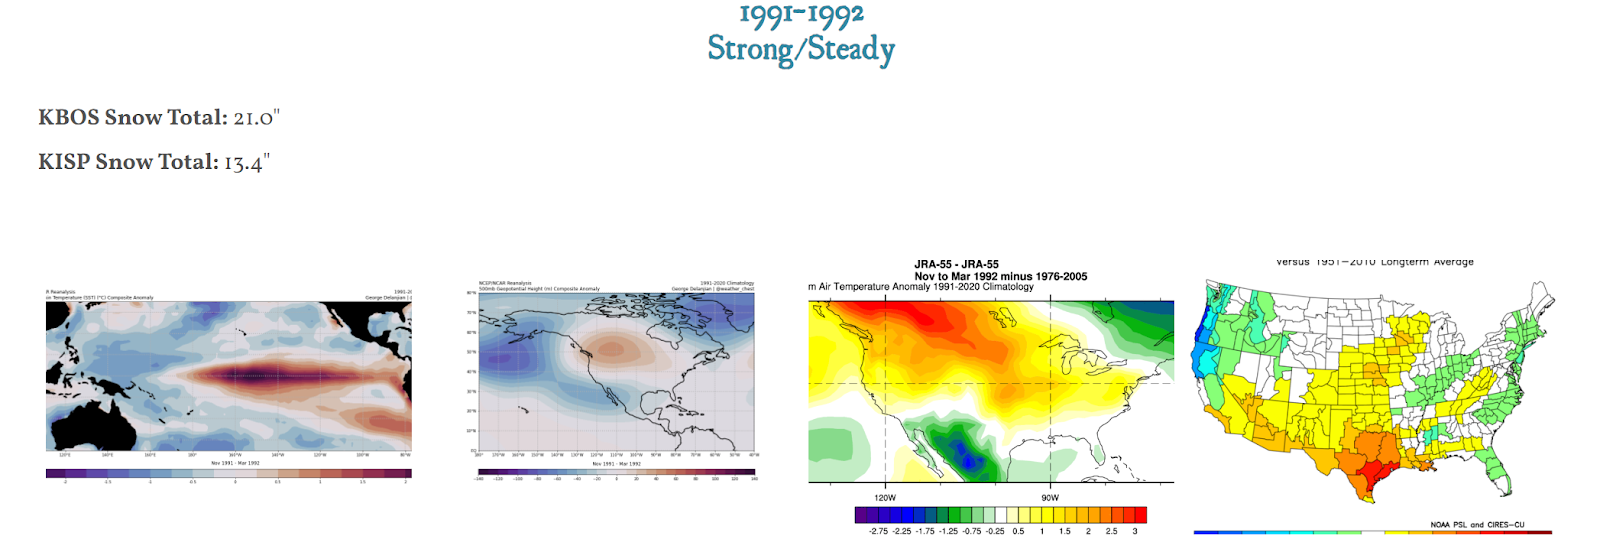 Two other years that stand out to me are 1972-1973 (EP) & 2009-2010 (CP). Both of those years entered winter with a strong El Nino and weakened over the wintertime. Those two winters did well, where 1972-1973 was slightly above normal snowfall for most locations and 2009-2010 was overall above average for most coastal spots in the Northeast U.S. Both winters had a -QBO. 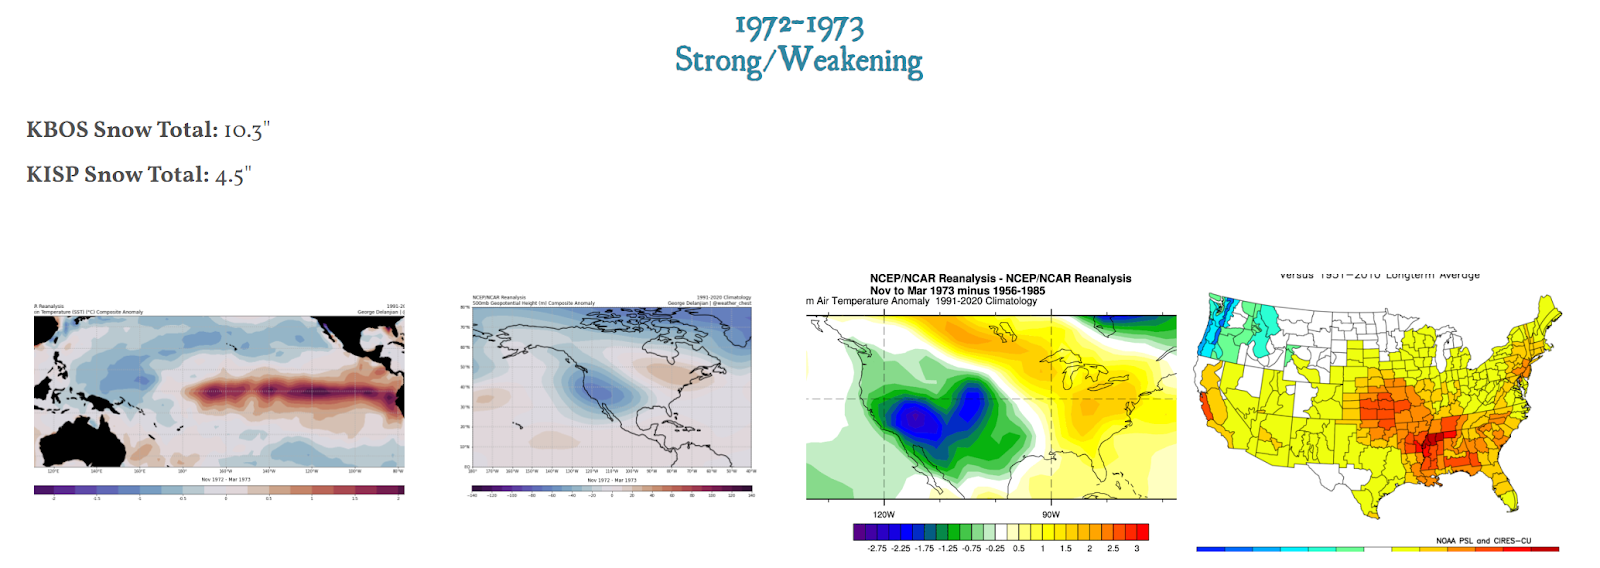 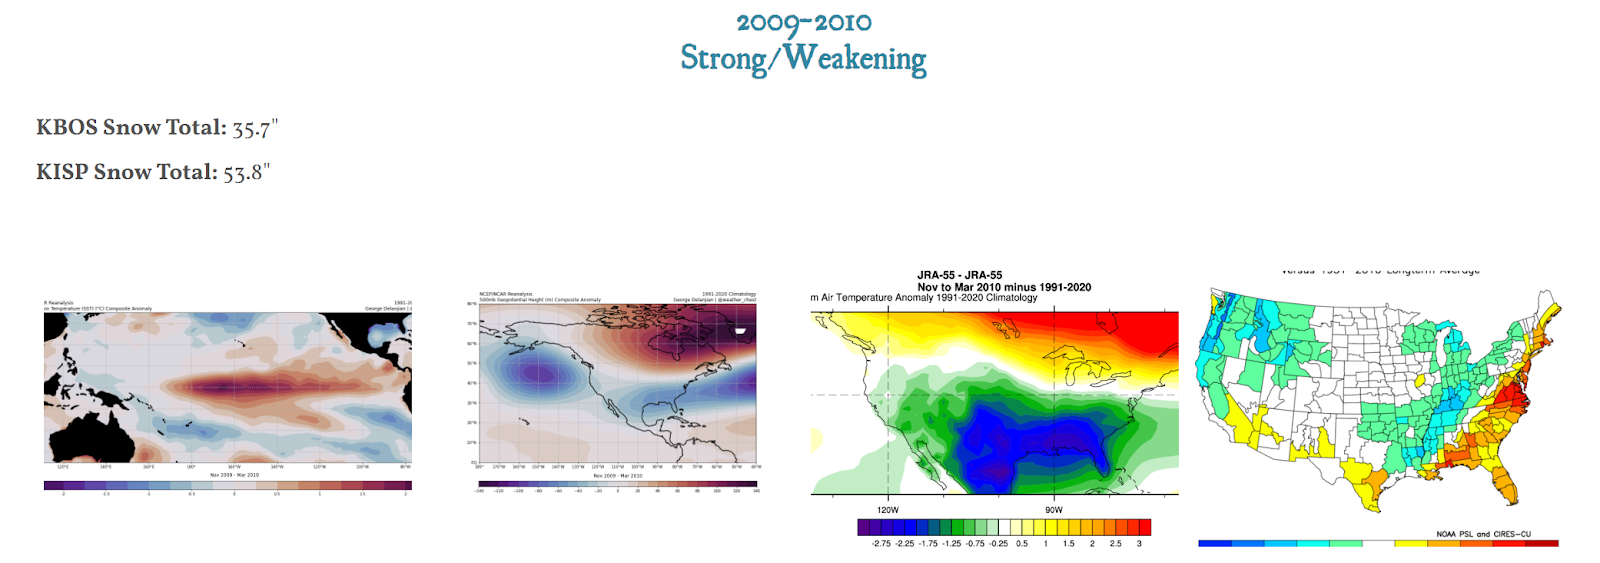 Another year that stood out to me that is worth mentioning is 1952-1953, where El Nino was east based and strengthening during the wintertime. This winter also produced nicely for the Northeast U.S. It should be noted the QBO was weakly negative this season. 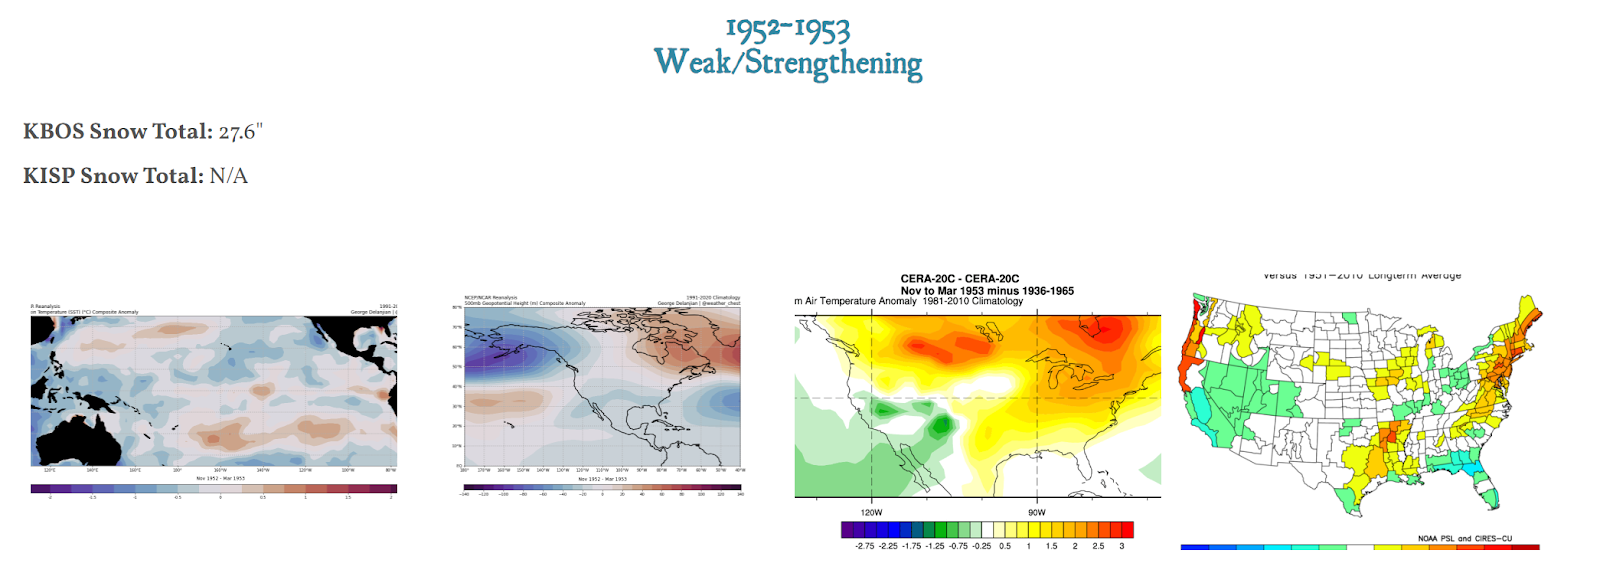 Forecast I've decided to take a blend of 1952-1953, 1957-1958, 1972-1973 & 2009-2010. I elected not to use 1991-1992 as I viewed that as an anomalous year due to the data set I collected above. When I created the composites below, there is a very evident -NAO pattern with a +EPO. While the +EPO look isn't great, it's worth noting the amount of troughing over much of the Lower 48, with the blocking pattern focused over Eastern Canada. To me, this still suggests a stormy/unsettled pattern overall. 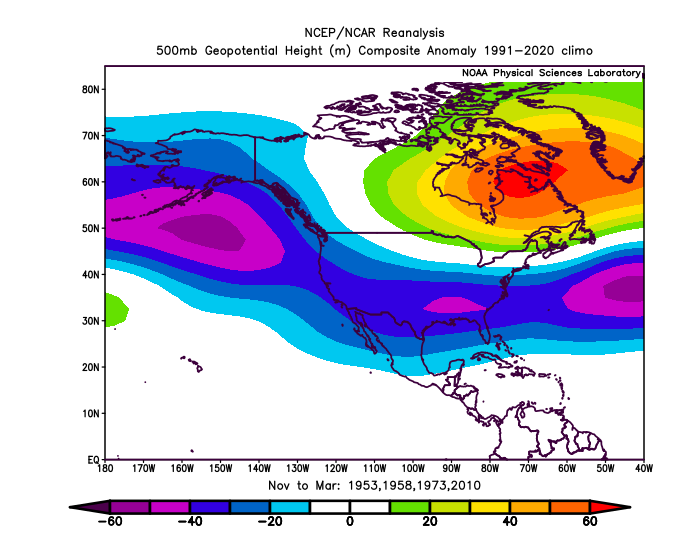 When analyzing the precipitation anomalies, much of the Eastern U.S., Southeast & California are showing above normal precipitation which bodes well for snow lovers. The Pacific Northwest shows lower than normal precipitation, which is normal for El Niño years. Overall, this is a pretty average El Nino look in regards to precipitation anomalies with a few minor exceptions. 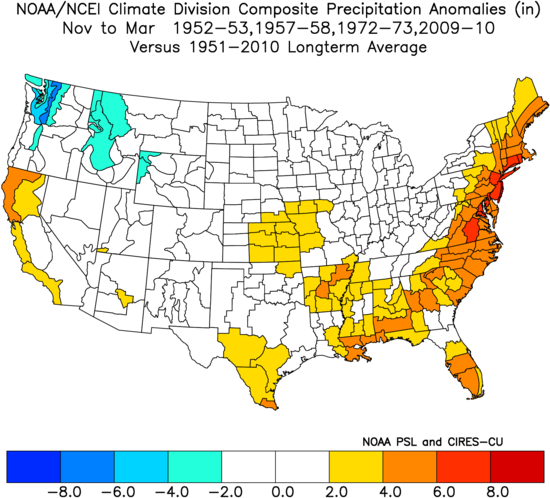 For temperature anomalies, warm anomalies are seen across the Pacific Northwest, Northern Plains, Midwest, Great Lakes and Northeast. Cooler than normal anomalies are observed over most of the Western U.S., Southwest, Southern Plains and Southeast. These temperature anomalies are textbook during warm phases of ENSO. All in all, nothing really stands out to me in regards to temperature anomalies. 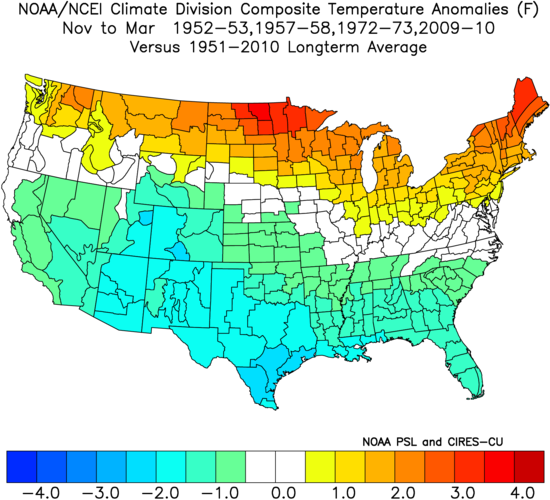 I think the composites above are a good depiction of what I would expect overall this upcoming season.
Of note, I do think given the modeled pattern, an EP El Nino and increase in stratospheric moisture, I foresee a realistic potential for a couple big storms this winter. I can even see the Southern Plains getting above average snowfall considering climatologically some of their "snowiest" winters have occurred during El Nino years. I intend on updating this forecast as I see fit, especially if the Eurasian Snow Cover Extent begins to trend above normal or the flavor of El Nino makes some sort of drastic shift. If you've made it this far, thank you for reading, and I hope this forecast serves you well and verifies! :D |
