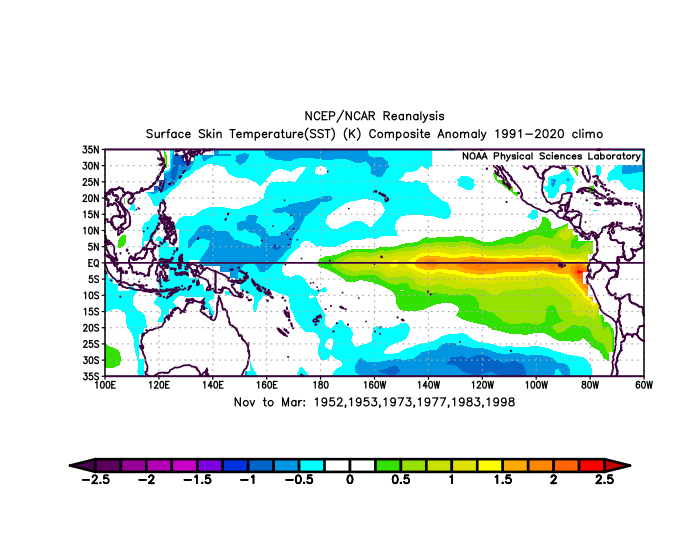
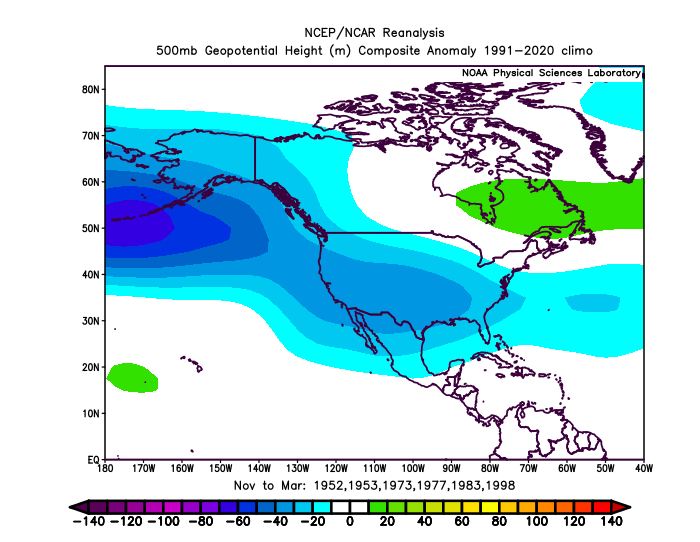
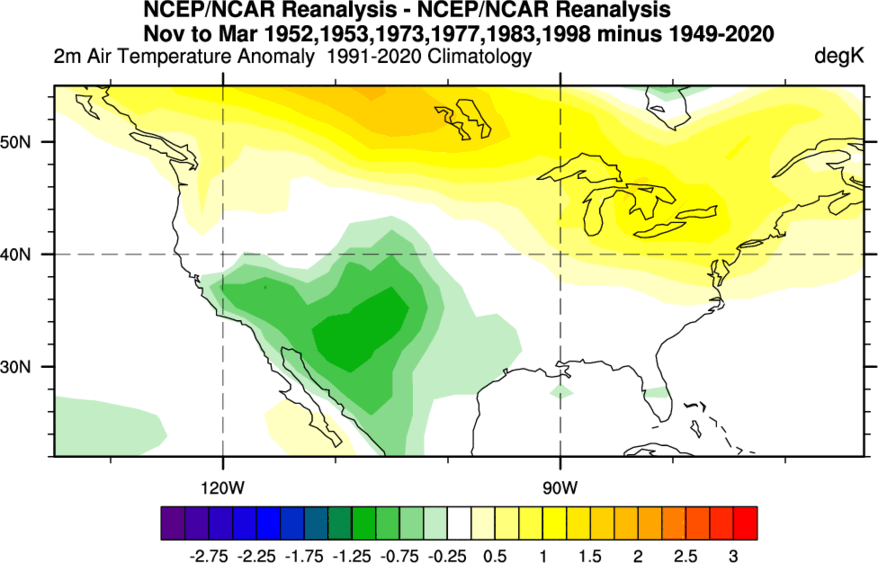
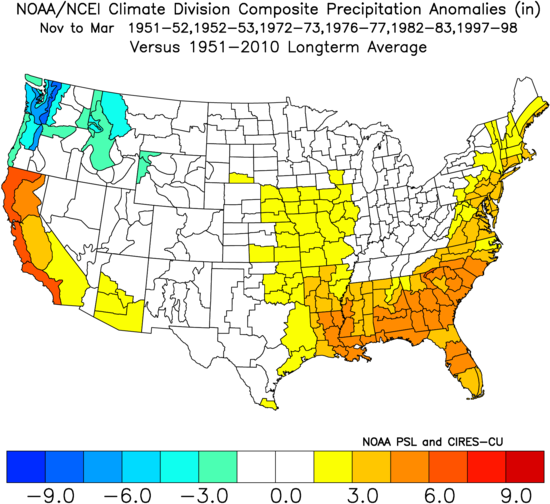
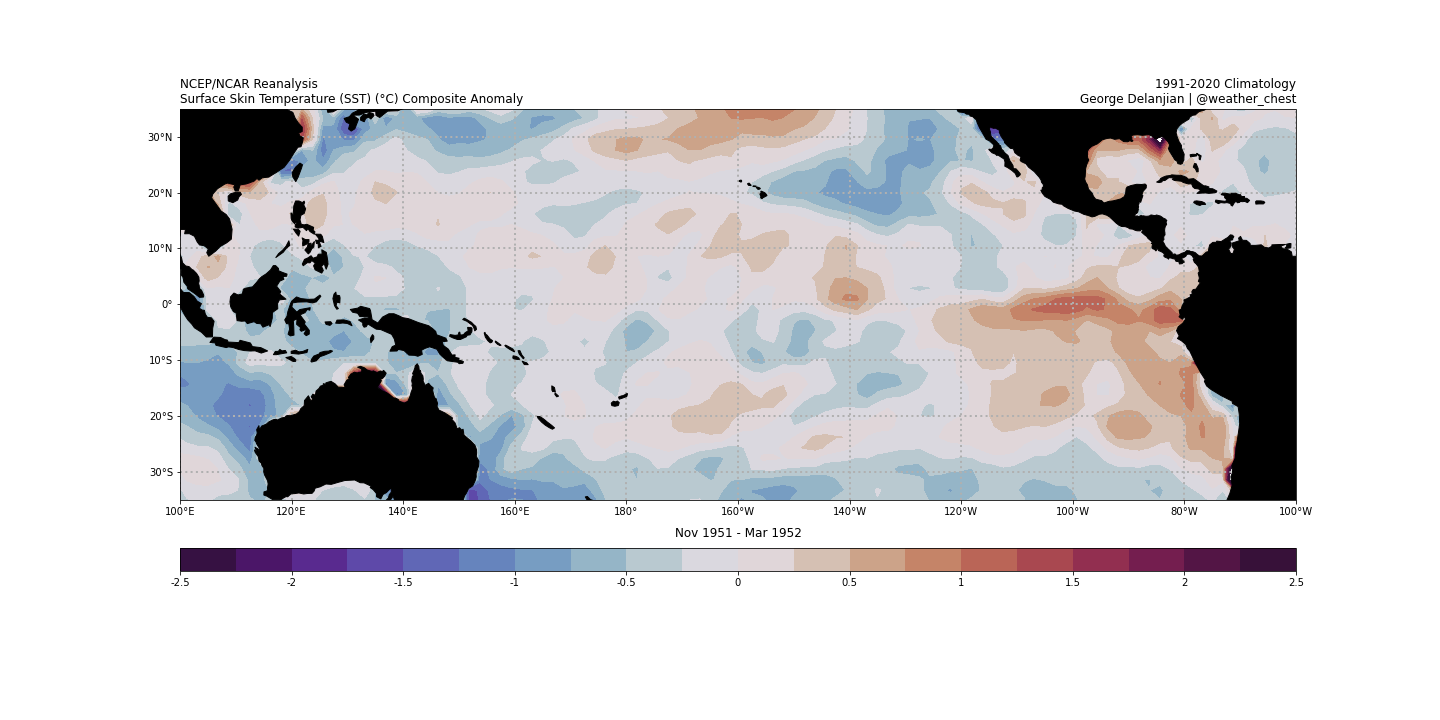
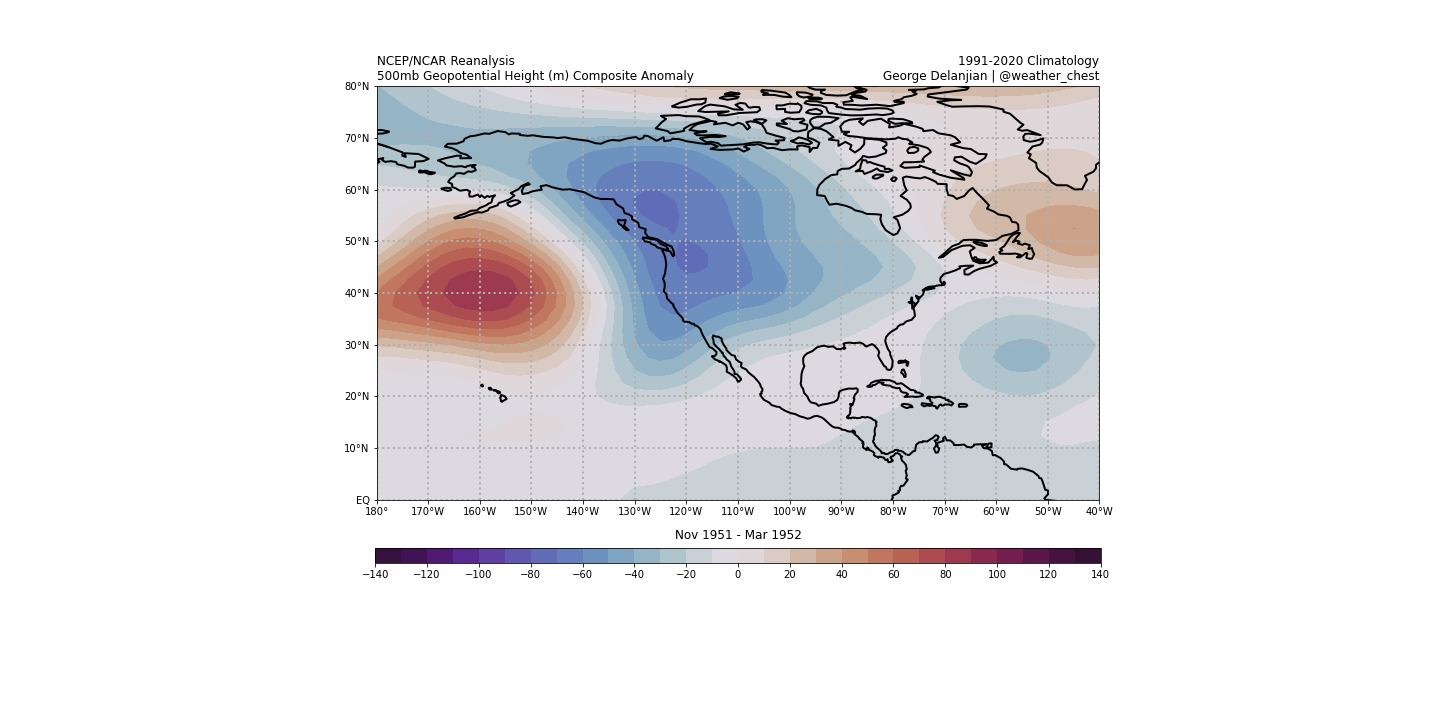
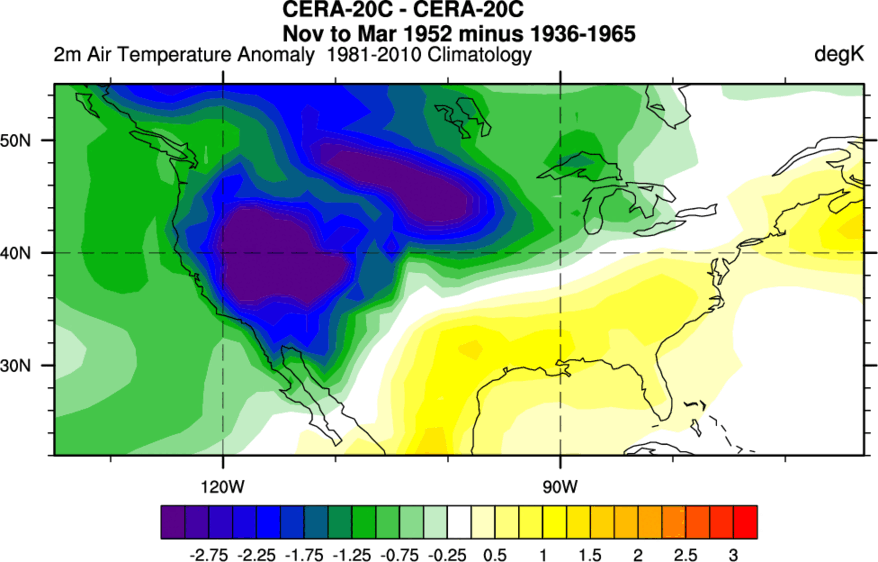
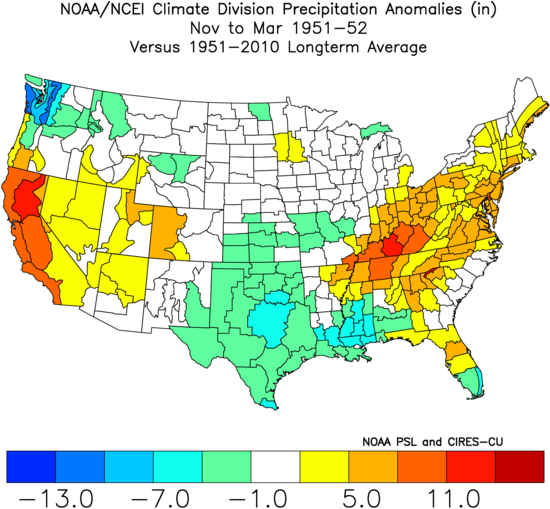
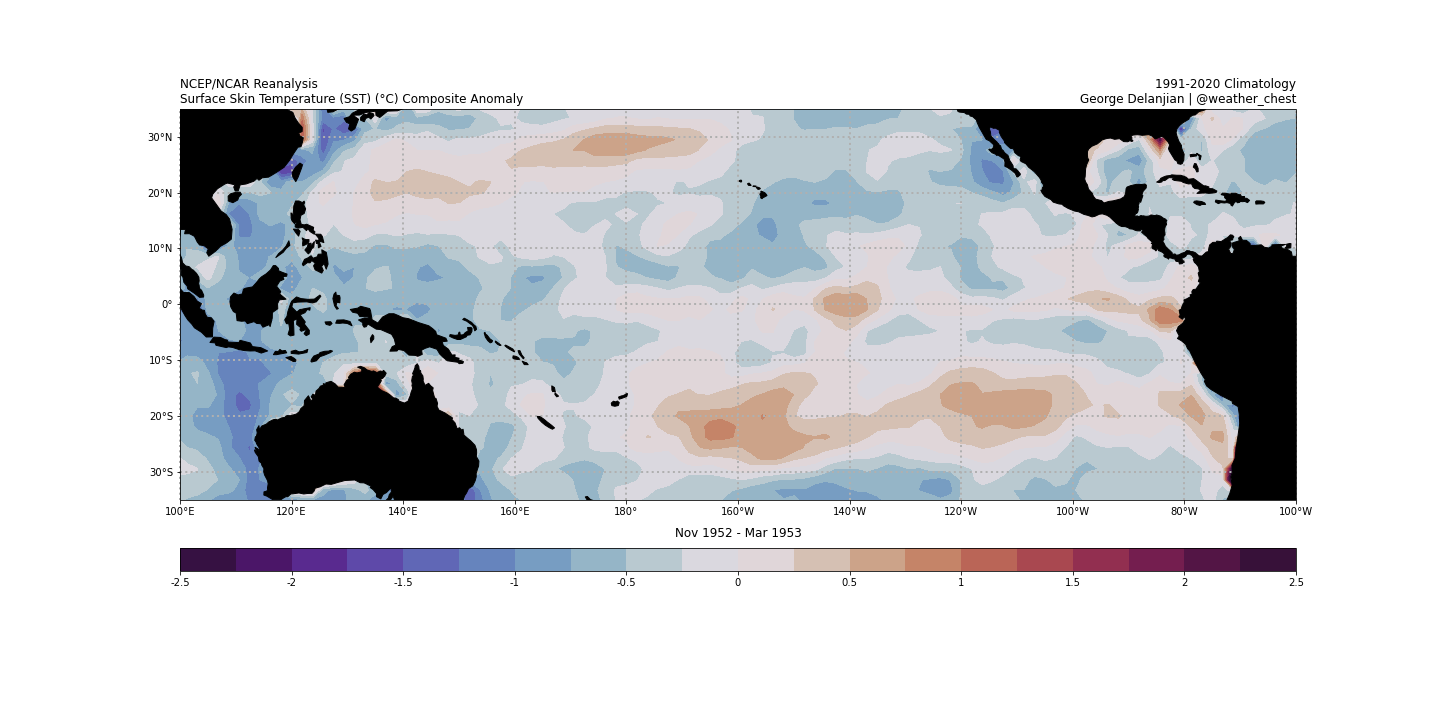
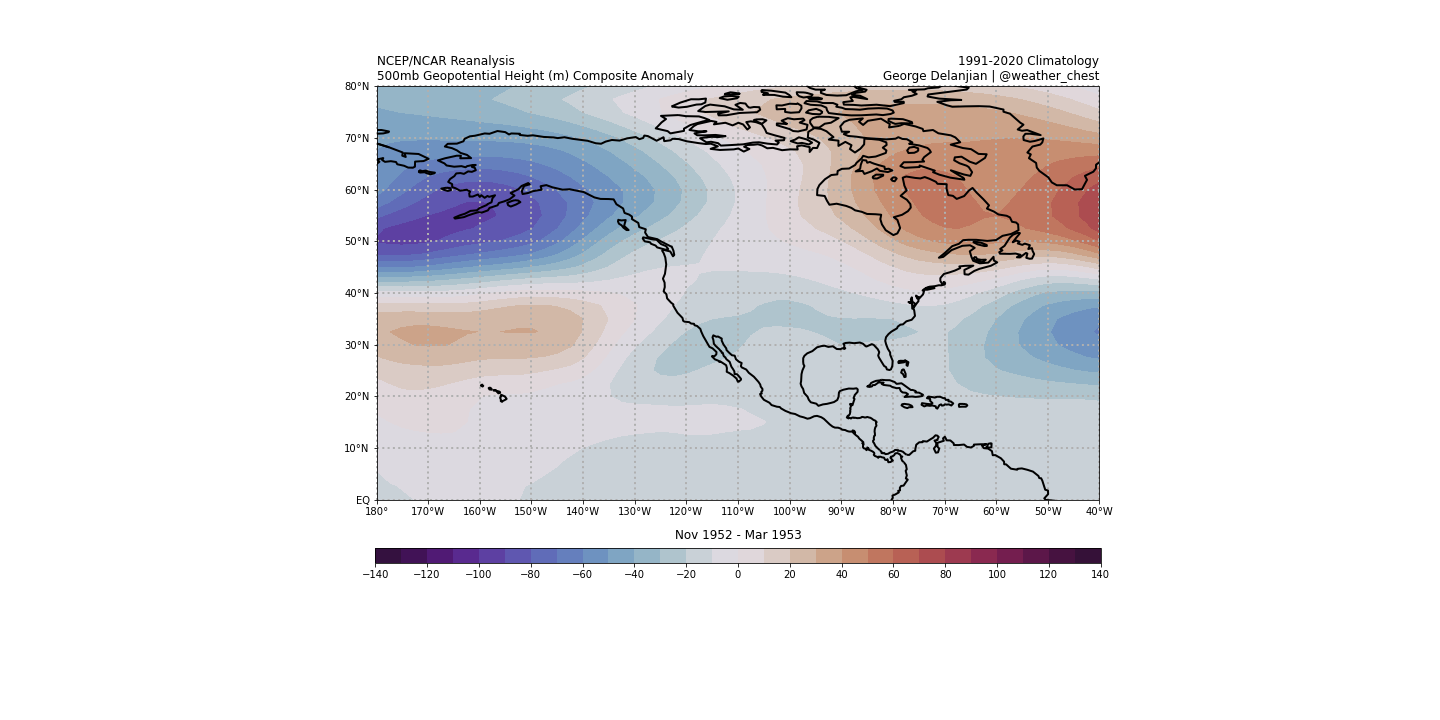
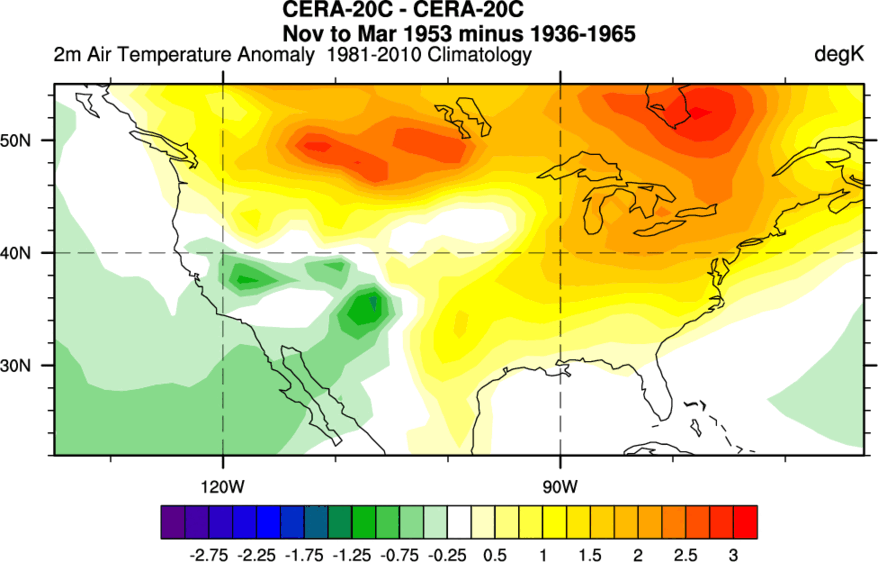
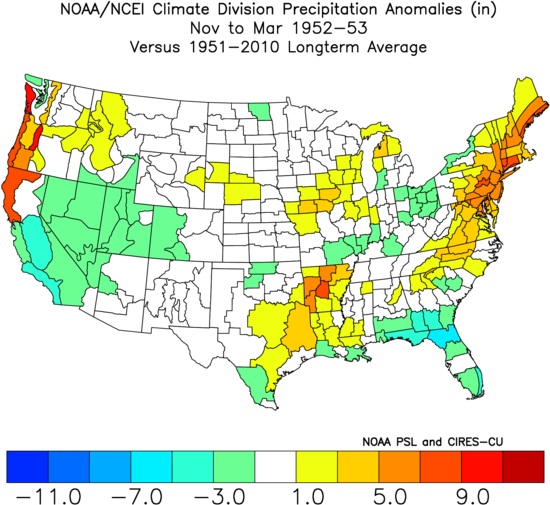
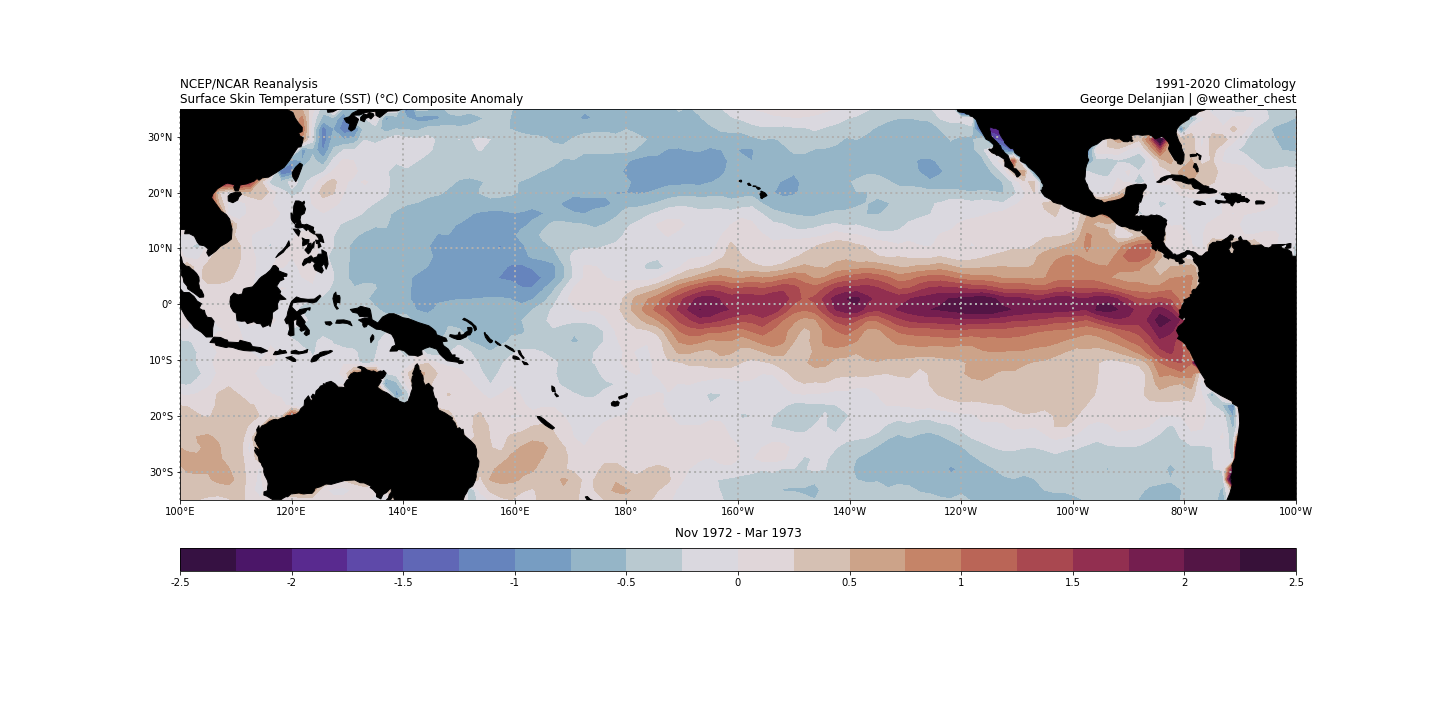
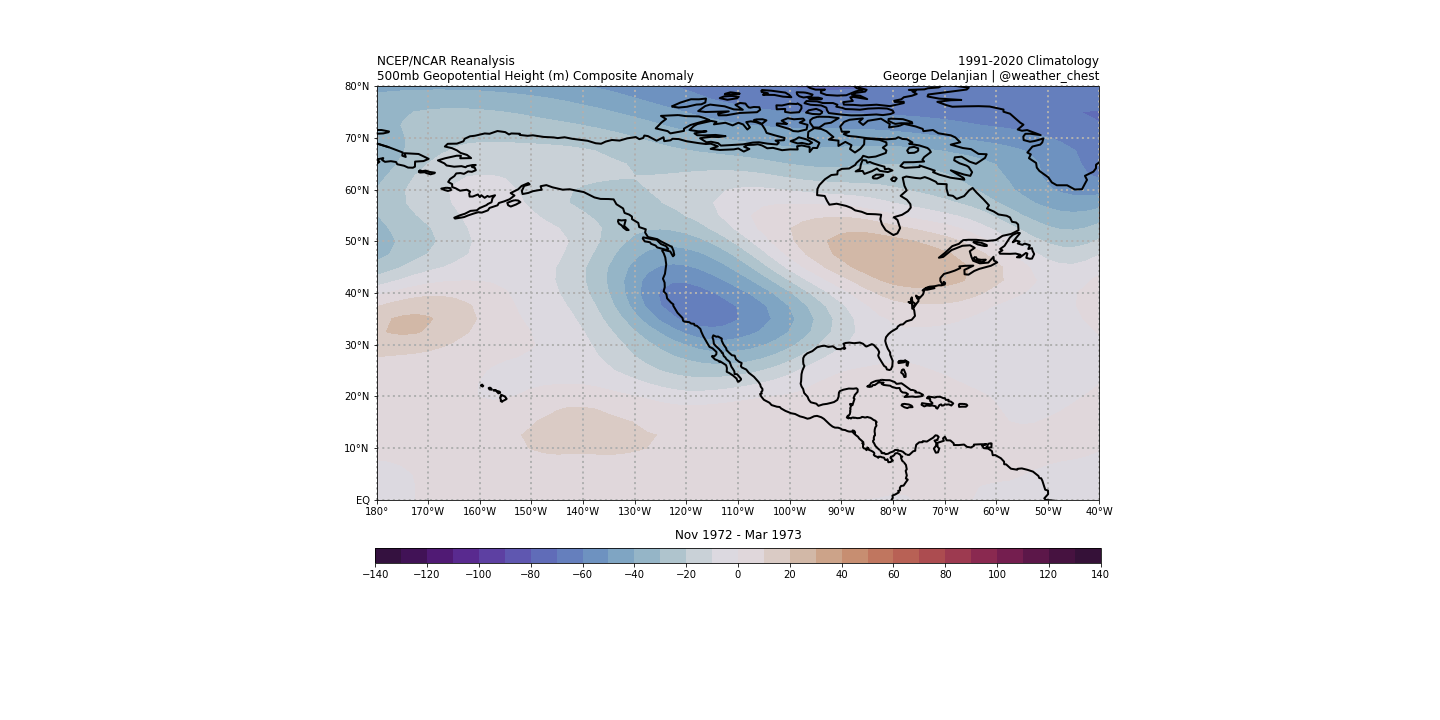
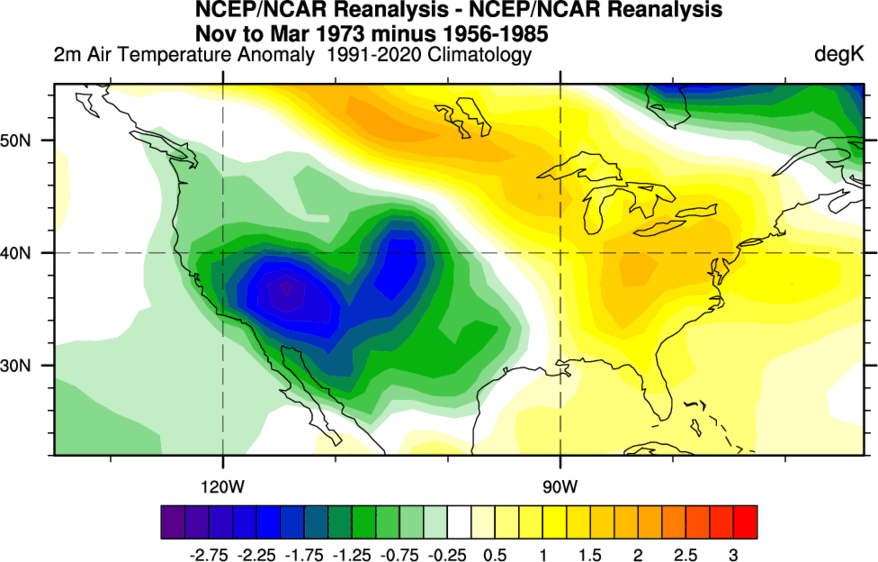
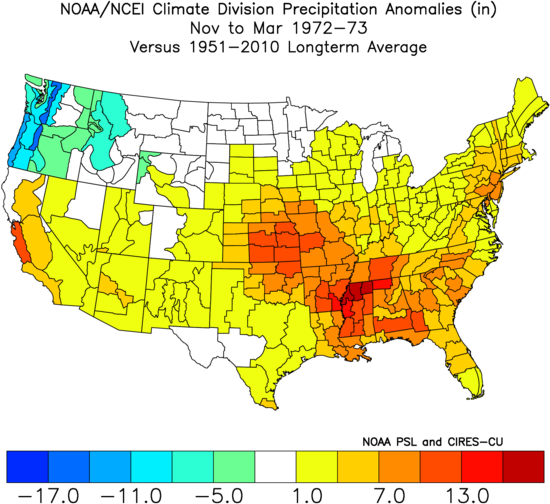
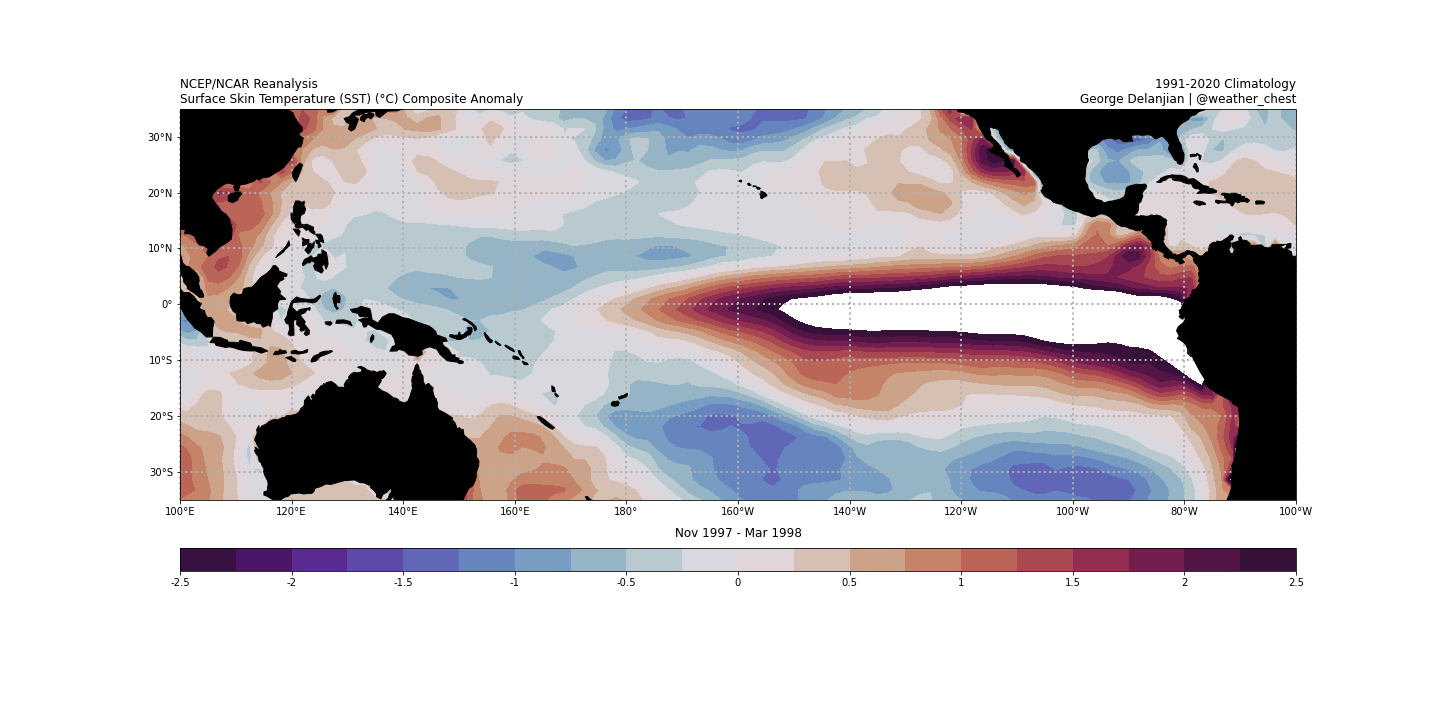
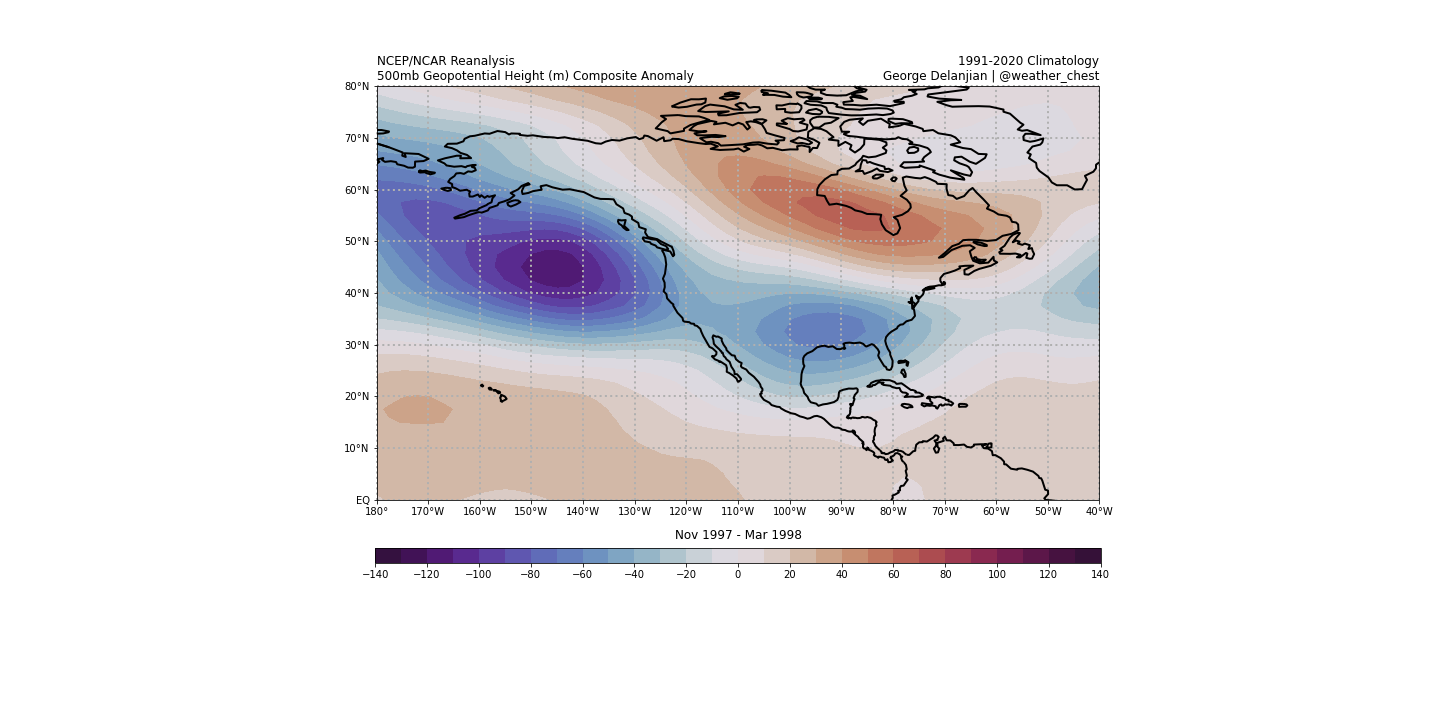
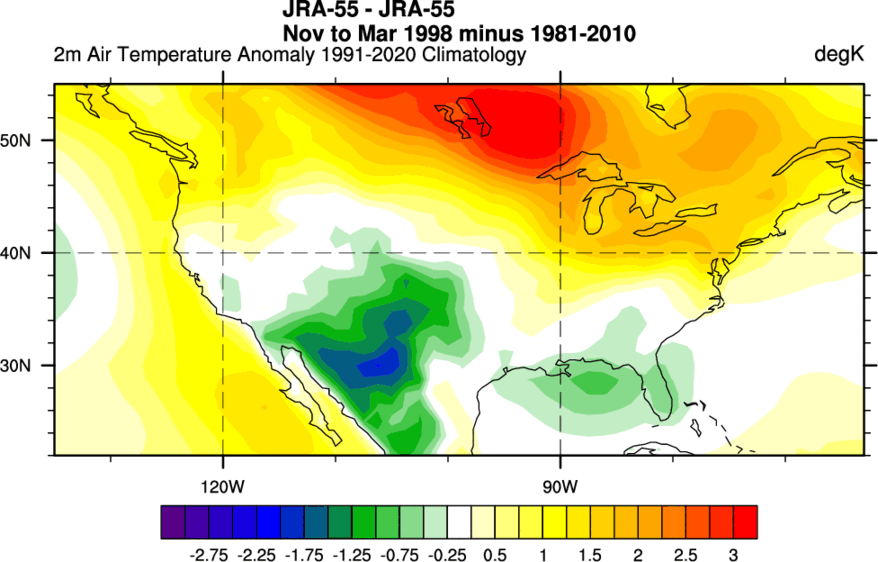
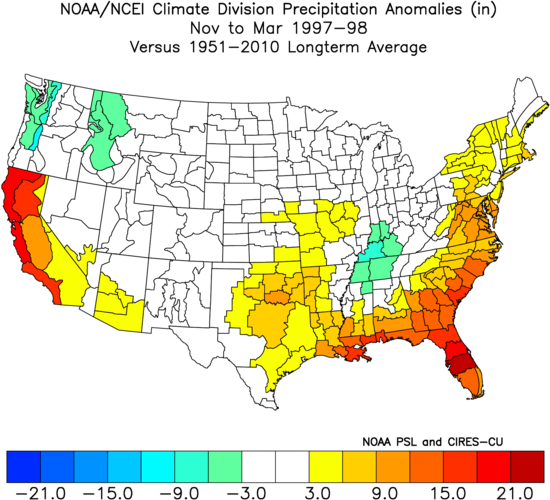
The following composites were generated using PSL's Climate Plotting and Analysis Tools covering November 1-March 31. These composites have fixed contour intervals (except for precipitation anomalies since its range varies so much from year to year), allowing for a consistent color-scheme for easier cross-analysis. While the terms "Modoki" and "Central Pacific" are used interchangeably (per research studies), I decided to separate the two due to what I found was enough disparity amongst the composites. I classified "Modoki" as composites that have cold-neutral anomalies on both sides of the warm pool whereas "Central Pacific" lacks those anomalies and is more central based. Below the years, I provided the average ONI for the NDJ, DJF, JFM periods, in addition to the ONI trend over those periods. The SSTa composites will not necessarily match the ONI classification listed since the ONI climatology periods used differs from the SSTa climatology used (1990-2020), giving less credibility to the state/trend classifications I listed below. All precipitation composites use 1951-2020 climatology. Temperature composite climatology depends on the dataset. If you would like to know my methodology, please contact send me a message.
East Pacific El Niño
1951-1952
Weak/Weakening
KBOS Snow Total: 31.9"
KISP Snow Total: N/A
KISP Snow Total: N/A
1952-1953
Weak/Strengthening
KBOS Snow Total: 27.6"
KISP Snow Total: N/A
KISP Snow Total: N/A
1972-1973
Strong/Weakening
KBOS Snow Total: 10.3"
KISP Snow Total: 4.5"
KISP Snow Total: 4.5"
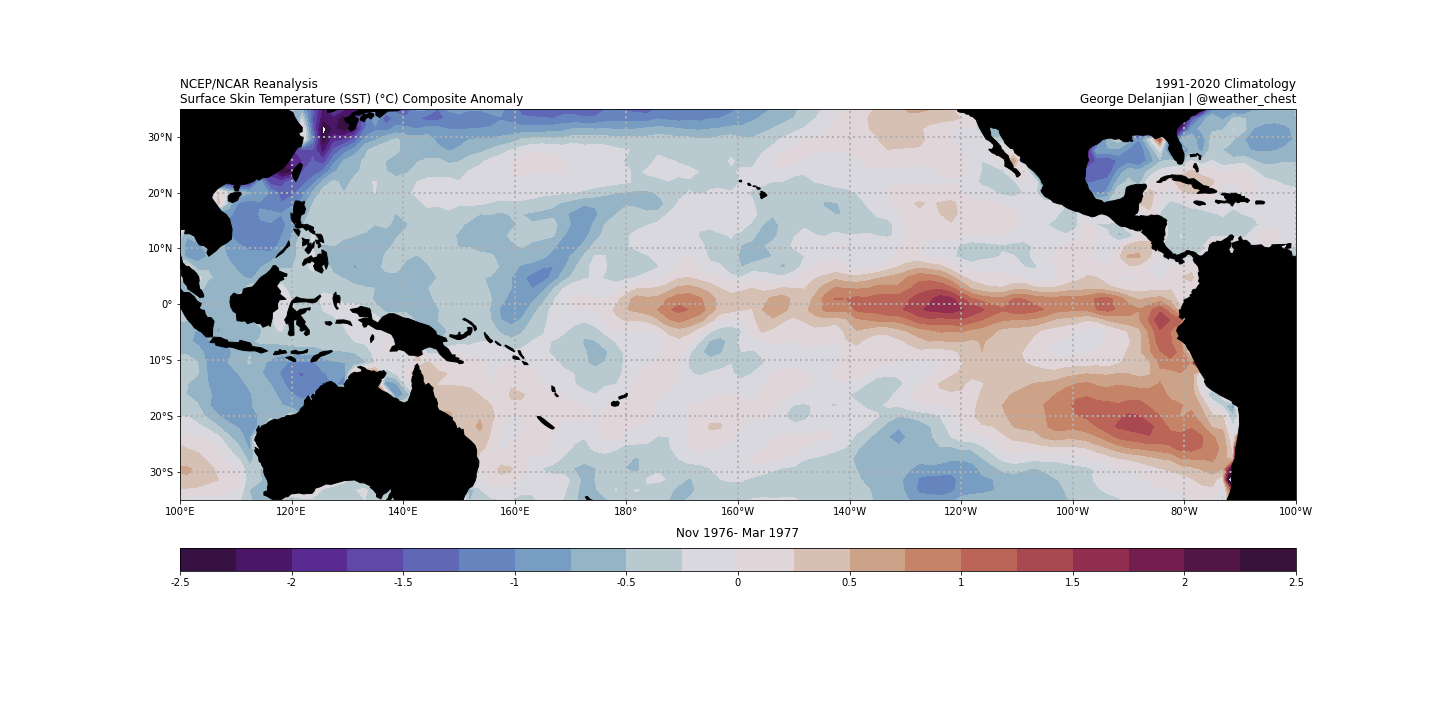
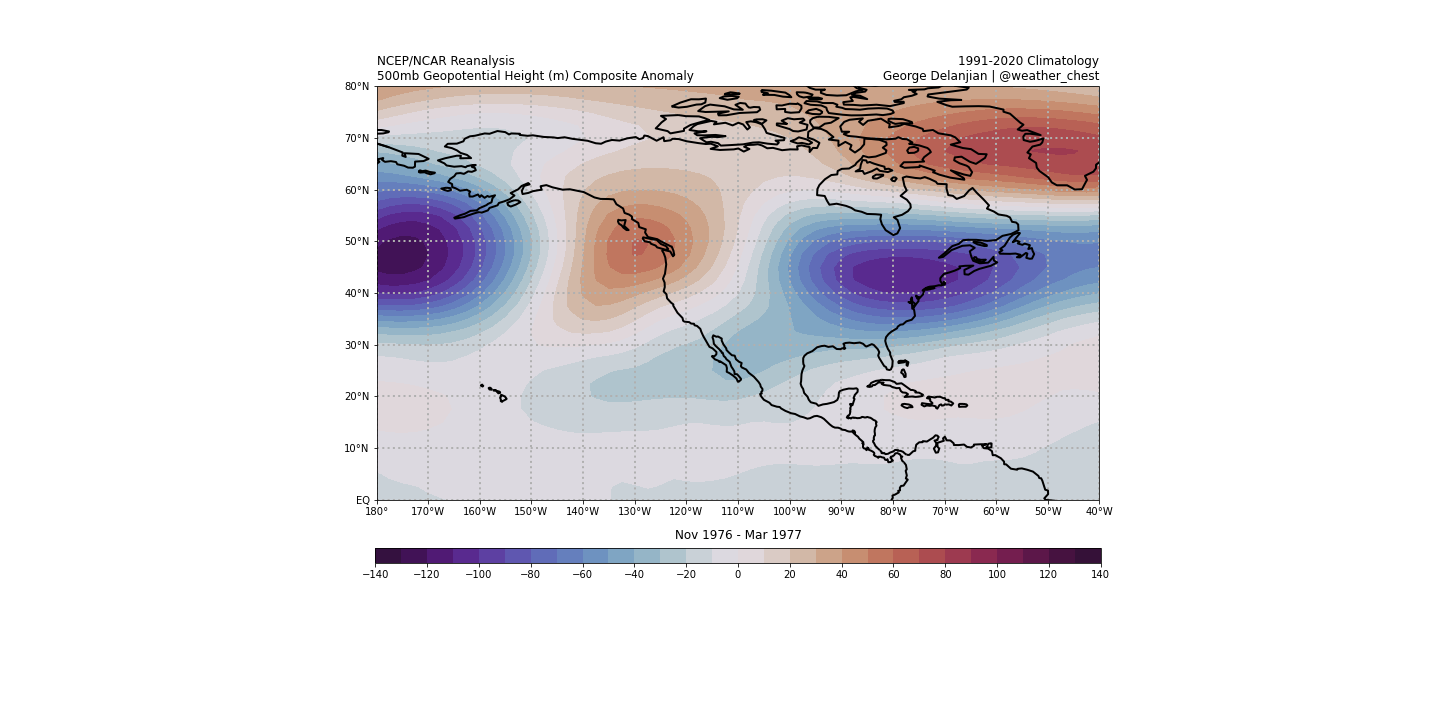
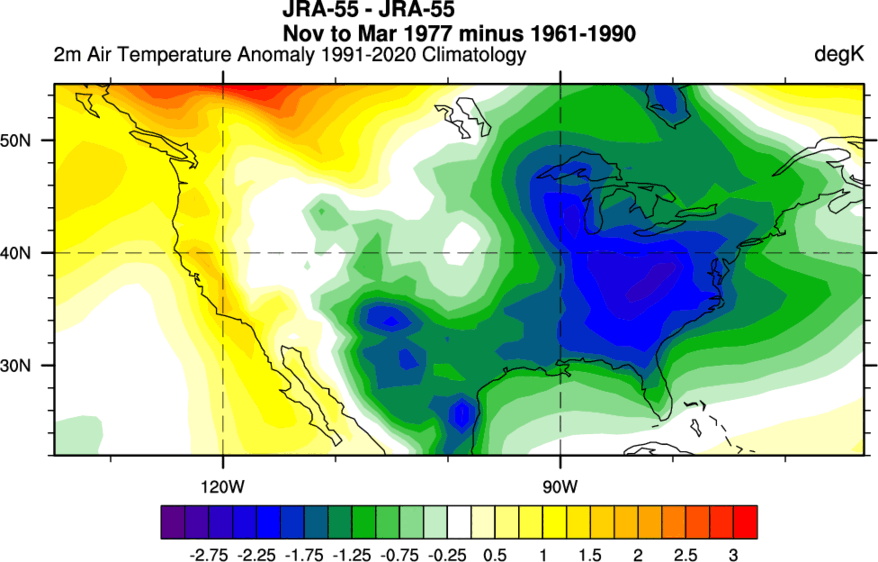
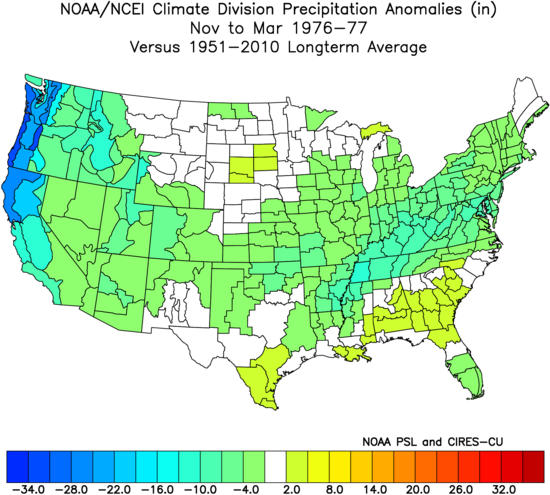
1976-1977
Weak/Weakening
KBOS Snow Total: 58.0"
KISP Snow Total: 28.0"
KISP Snow Total: 28.0"
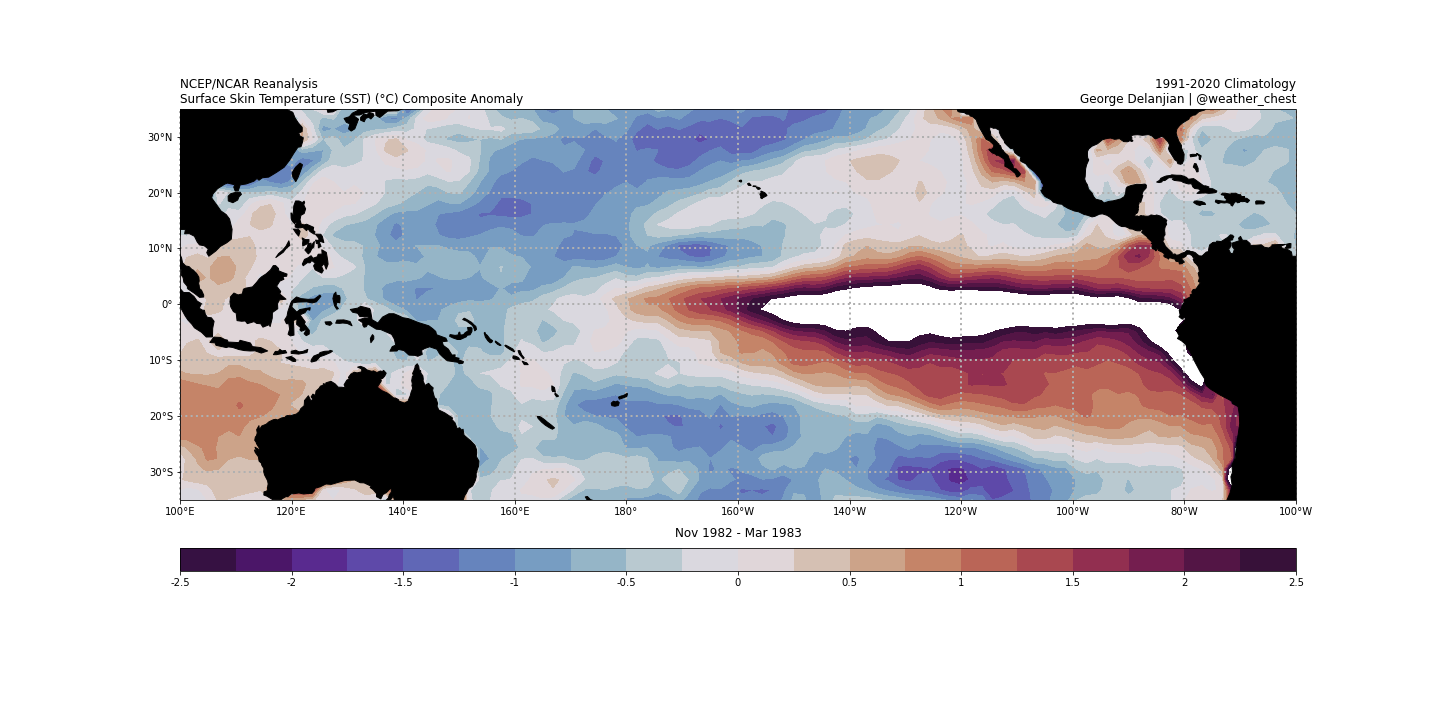
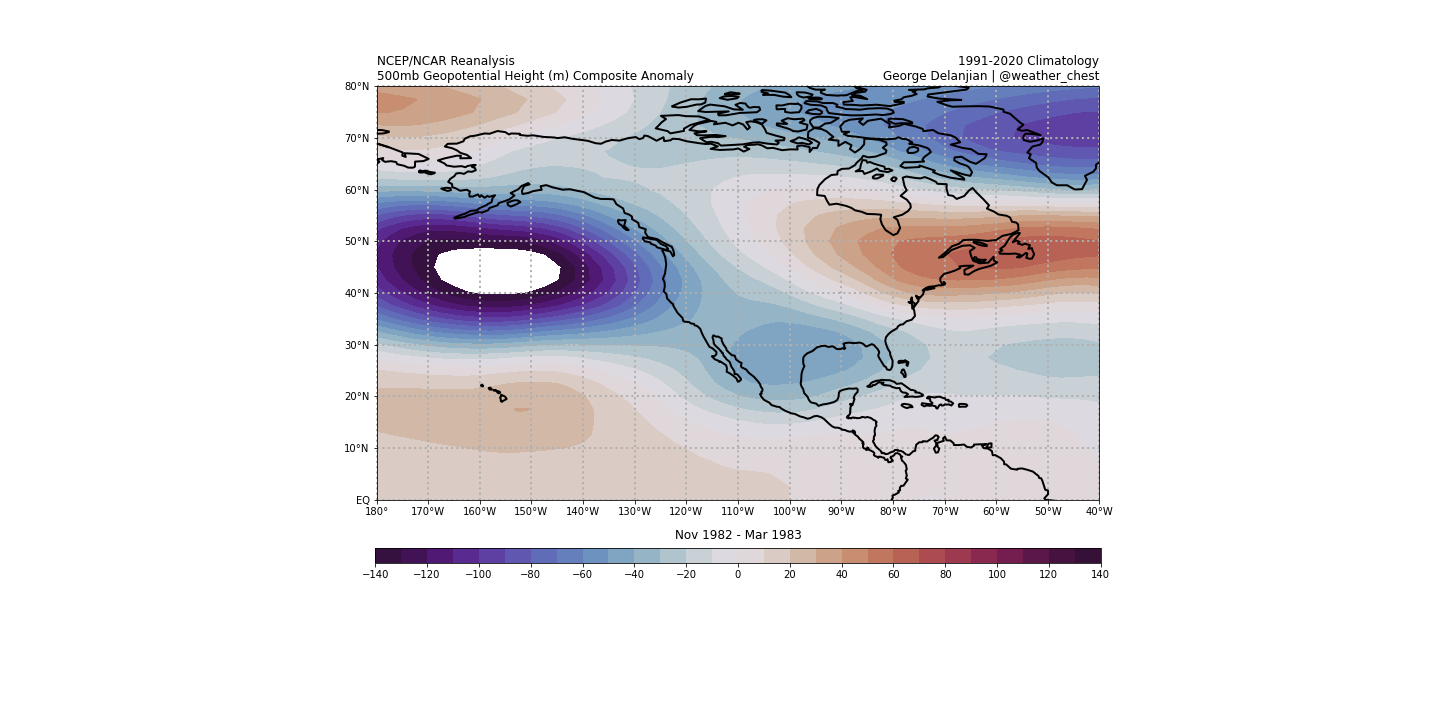
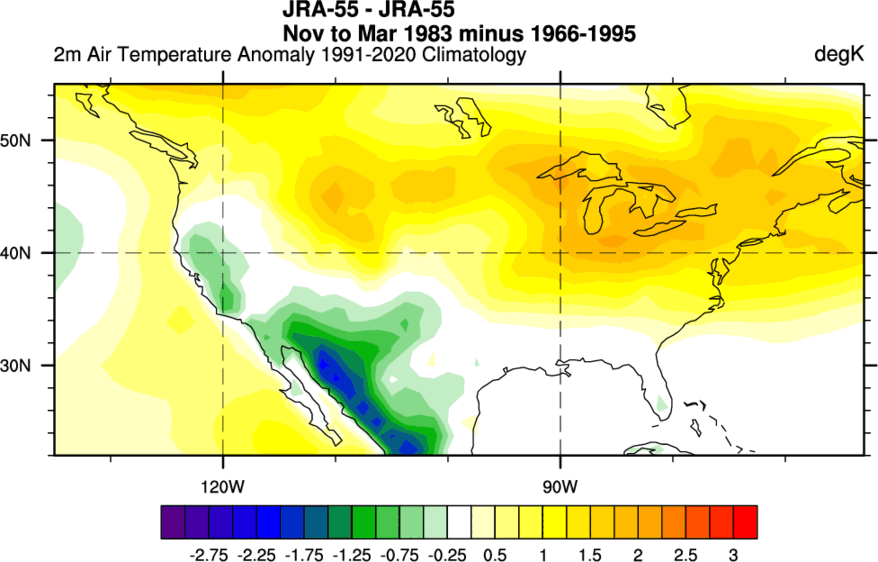
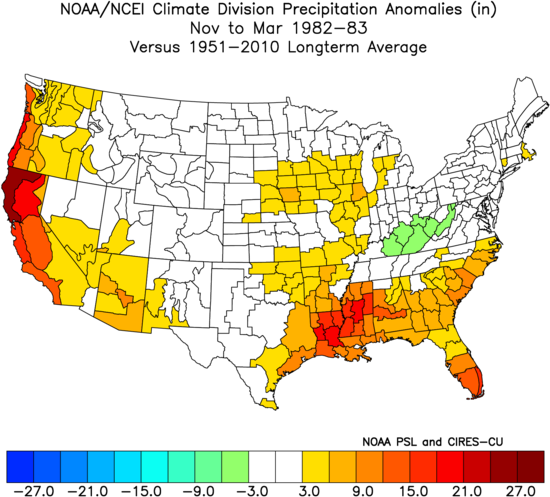
1982-1983
Very Strong/Weakening
KBOS Snow Total: 32.7"
KISP Snow Total: 30.8"
KISP Snow Total: 30.8"
1997-1998
Very Strong/Weakening
KBOS Snow Total: 25.6"
KISP Snow Total: 2.6"
KISP Snow Total: 2.6"
Average
KBOS Average: 31.6"
KISP Snow Total: 16.5"
KISP Snow Total: 16.5"